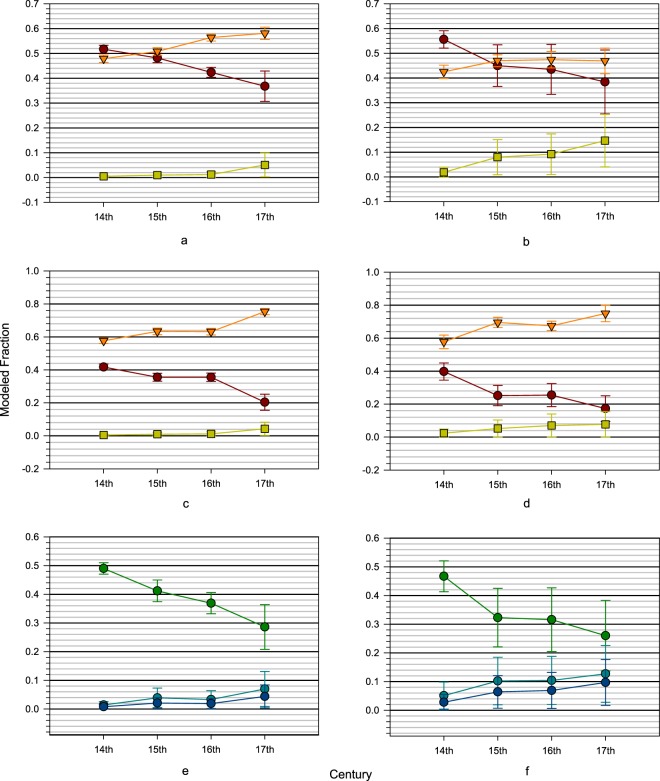
Figure 2.
Mean values of three-source models by century for (a) dentine collagen, (b) bone collagen, (c) enamel-dentine collagen, (d) enamel-bone collagen. Red circles = fish, orange triangles = maize, green squares = terrestrial animals. Mean values of three fish categories in the five-source models by century for (e) dentine collagen and (f) bone collagen. Green circles = high δ15N fish, light blue circles = medium δ15N fish, and dark blue circles = low δ15N fish. Error bars are 1 standard deviation.

