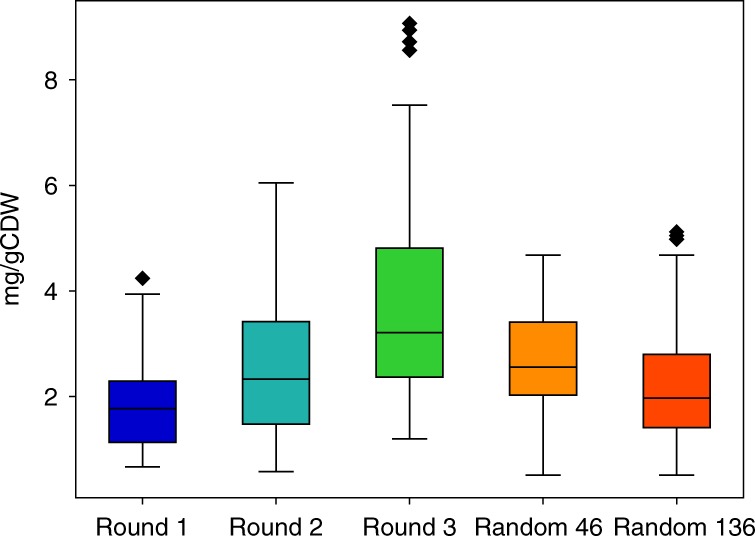
Fig. 4.

Lycopene production in different rounds of pathway optimization and random screening. The average and maximum points have increased after each round of pathway optimization. Moreover, although the average and maximum of evaluating 46 and 136 random points are a little more than the uniform distribution in round 1, they are significantly lower than the points picked by the algorithm in the subsequent rounds. The boxes of the plots contain data within the interquartile range (IQR), while whiskers spread from the boxes to 1.5 times IQR. The center line in the boxes is the median of the data and points above the whiskers are values which are higher than 1.5 times IQR above the third quartile. n = 46, 45, 45, 46 and 136 for each plot, respectively. Source data are provided as a Source Data file
