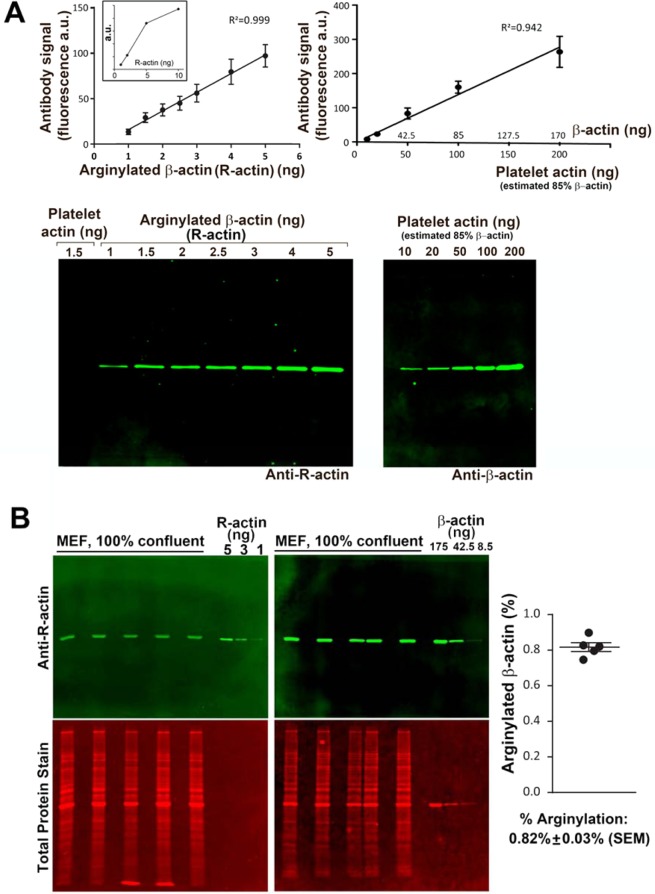
Figure 1.
Quantification of the percentage of arginylated actin in mouse embryonic fibroblasts. (A) Calibration of the antibody signal using purified platelet actin (85% β-actin) and pure N-terminally arginylated β-actin (R-actin) expressed in Pichia pastoris. Error bars represent SEM, n = 6 for R-actin and 5 for platelet actin. The inset in the left graph shows the calibration curve with the additional point to show the limit of the linear range. (B) Quantification of the percentage of R-actin in confluent mouse embryonic fibroblasts (MEF). Error bars represent SEM, n = 5. See also Fig. S1 for antibody specificity and Fig. S2A for the raw data on the antibody signal used for the quantifications in this panel.

