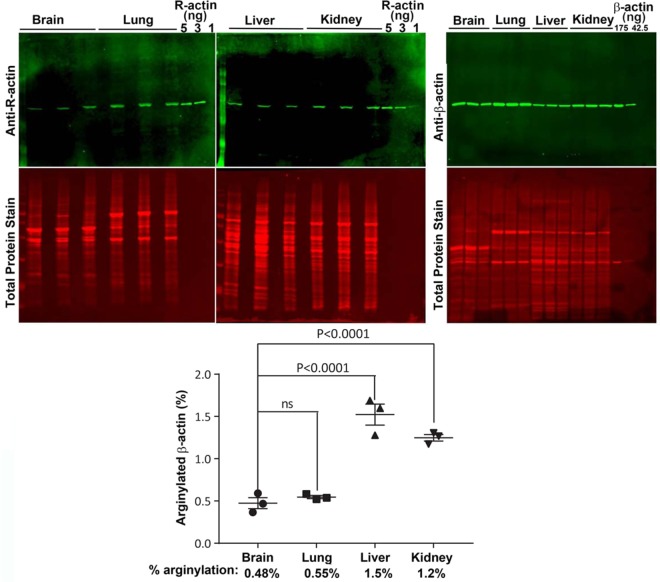
Figure 4.
Different mouse tissues contain different levels of R-actin. Top, Western blots of four different tissues from wild type mice. Bottom, quantification of R-actin in different tissues. Analysis of variance (ANOVA) test was used to calculate the statistical difference between different tissues in the group. Error bars represent SEM, n = 3 biological replicates. See Fig. S2B for the raw data on the antibody signal used for the quantifications in this panel.

