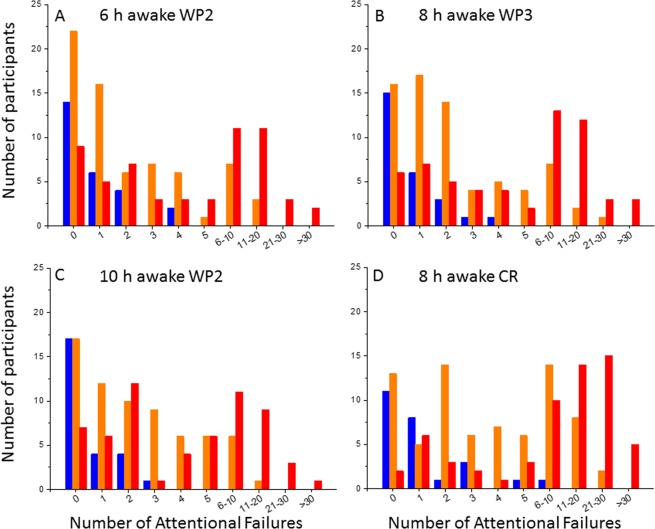
Figure 6.
Distribution of response to sleep loss phenotypes under different baseline test sessions. Histograms of the number of attentional failures observed at ~6 h awake on study day/wake period 2 (WP2), ~10 h awake on WP2, ~8 h awake on study day/wake period 3 (WP3), and ~8 h awake on constant routine (CR). Attentional failures are stratified by response phenotype at ~20 h awake (resilient, blue; intermediate, orange; vulnerable, red). These observations confirm the finding from Fig. 5A (~8 h awake WP2) that a single partition at <2 versus 2 or more attentional failures can robustly identify a subset of participants who exhibit intermediate or vulnerable phenotypes at ~20 h awake across several time points.

