Fig. 1.

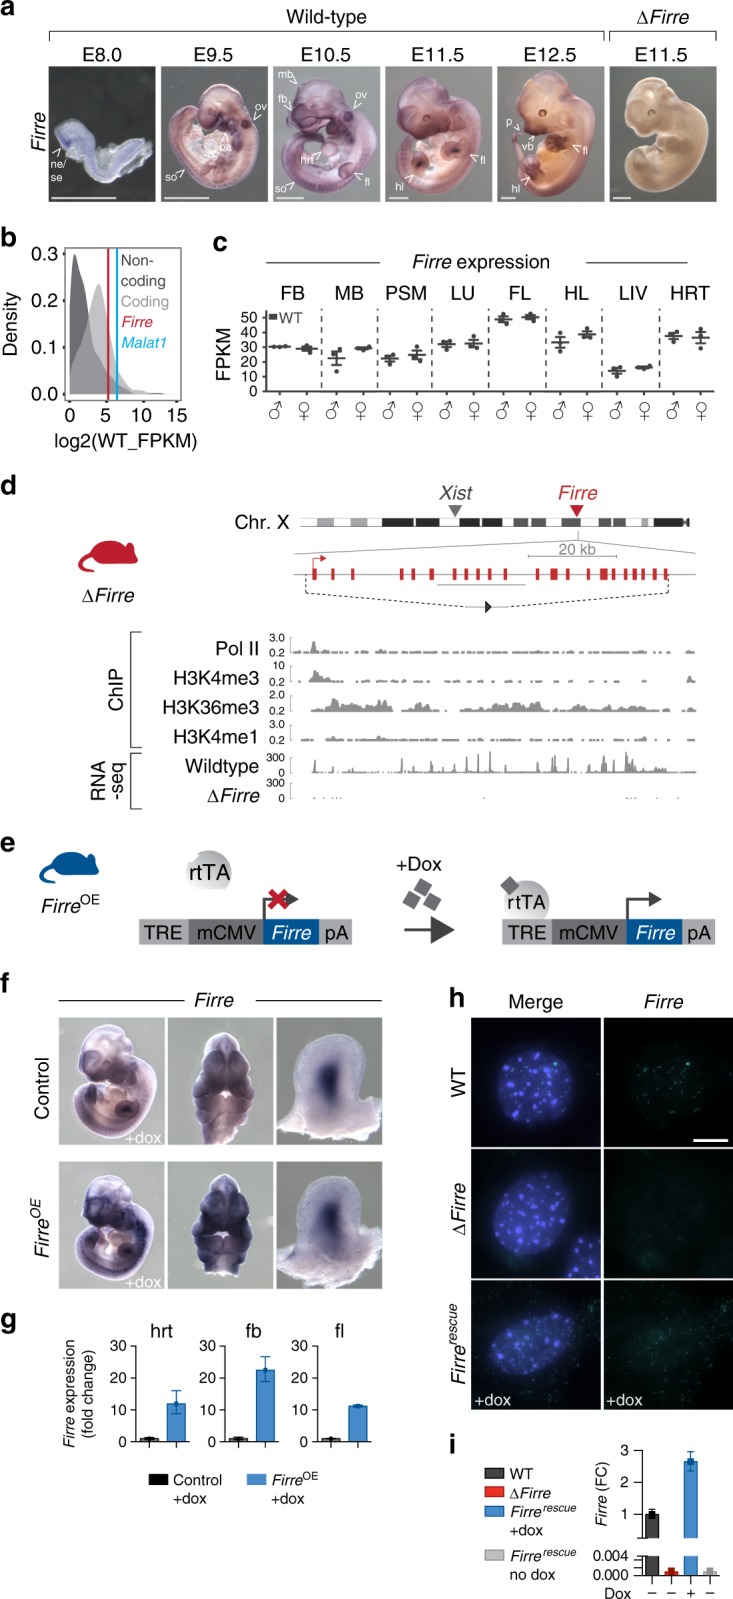
Mouse models to interrogate the in vivo function of Firre. a Whole-mount in situ hybridization for Firre RNA in WT mouse embryos at E8.0 (n = 4), E9.5 (n = 4), E10.5 (n = 5), E11.5 (n = 6), E12.5 (n = 4), and ∆Firre E11.5 embryos (n = 3). Scale bar equals 1 mm. b Distribution of transcript abundances for protein-coding (light gray) and noncoding (dark gray) genes in WT E11.5 heart tissue (representative tissue shown from seven additional tissues). Vertical lines indicate Firre (red) and Malat1 (blue). c Expression of Firre shown as fragments per kilobase of transcript per million mapped reads (FPKM) from RNA-seq in E11.5 WT male (n = 3) and female (n = 3) forebrain (FB), midbrain (MB), pre-somitic mesoderm (PSM), lung (LU), forelimb (FL), hindlimb (HL), liver (LIV), and heart (HRT). The data shown as mean ± standard error of the mean (SEM). d Firre knockout mouse (red). Schematic of mouse X chromosome ideogram showing the Firre locus relative to Xist. UCSC genome browser diagram of the Firre locus (shown in opposite orientation). Dashed lines indicate the genomic region that is deleted in ∆Firre mice; single loxP scar upon deletion (gray triangle). Histone modifications and transcription factor binding sites in mouse embryonic stem cells (mESC-Bruce4, ENCODE/LICR, mm9). RNA-seq tracks for the Firre locus in WT and ∆Firre E11.5 forelimbs. e Schematic of doxycycline (dox)-inducible Firre overexpression mouse (FirreOE). Tet-responsive element (TRE), minimal CMV promoter (mCMV), reverse tetracycline transcriptional activator (rtTA), and β-globin polyA terminator (pA). f In situ hybridization for Firre at E11.5 in control (WT or tg(Firre) +dox) (n = 4) and FirreOE +dox (n = 3) embryos. g qRT-PCR for Firre expression shown as fold change (FC) in dox-treated E11.5 control and FirreOE hrt, fb, and fl. h RNA FISH for Firre in male WT, ∆Firre, and Firrerescue MEFs. DAPI (blue) marks the nucleus and Firre RNA is shown in green. Scale bar equals 10 µm. i qRT-PCR for Firre expression shown as FC in male WT, ∆Firre, Firrerescue +dox, and Firrerescue no dox MEFs. Expression normalized to β-actin in the control or WT sample. The data plotted as mean ± CI at 98%. Source data are provided in the Source Data file
