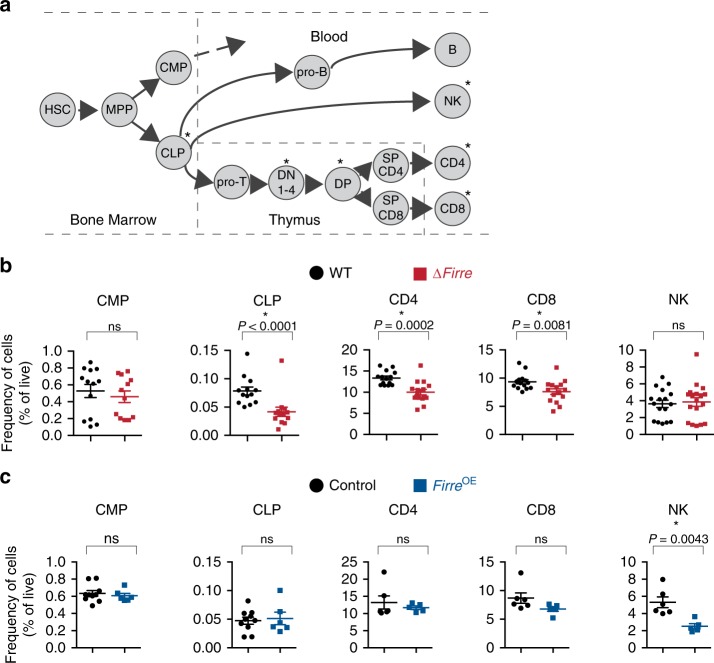
Fig. 3.
∆Firre and FirreOE mice have cell-specific hematopoietic phenotypes. a Schematic of hematopoiesis. b Frequencies of common myeloid progenitors (CMP) and common lymphoid progenitors (CLP) in the bone marrow shown from WT (n = 13, black circles) and ∆Firre (n = 12-13, red squares) mice. Two representative experiments combined (three independent experiments). Frequencies of CD4 and CD8 cells from the peripheral blood from WT (n = 14) and ∆Firre (n = 15) mice. Frequency of NK cells from the peripheral blood from WT (n = 17) and ∆Firre (n = 18) mice. Three representative experiments combined (seven independent experiments). c Frequencies of CMPs and CLPs from the bone marrow from control (tg(Firre) or WT or rtTA with dox) (n = 10, black circle) and FirreOE +dox (n = 6, blue square) mice. One representative experiment is shown (two independent experiments). Frequencies of CD4, CD8, and NK cells from the peripheral blood from control (WT or tg(Firre) or rtTA with dox) (n = 6, black circle) and FirreOE +dox (n = 5, blue square) mice. One representative experiment is shown (three independent experiments). Cell frequencies determined by flow cytometry analysis. The data are plotted as percent (%) of live cells showing the mean ± SEM, and statistical significance determined by a two-tailed Mann–Whitney U test. Source data are provided in the Source Data file

