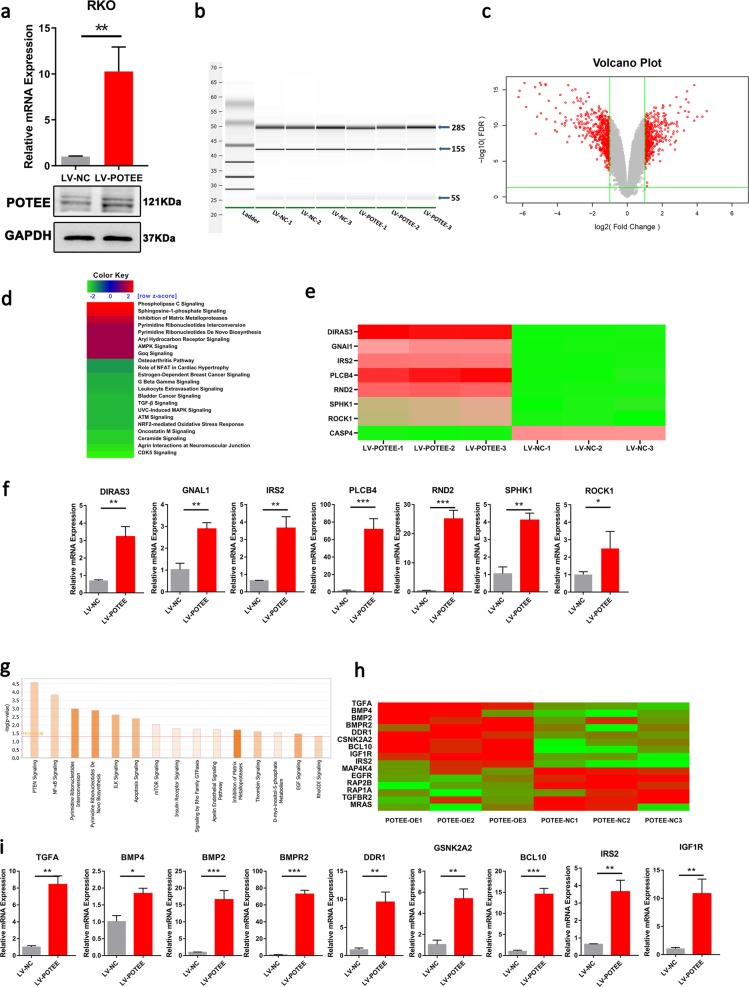
Fig. 3. RNA-seq reveals POTEE-regulated signaling pathways in CRC.
a qRT-PCR (left) and western blot (right) showing POTEE expression in RKO cells with POTEE overexpression or mock cells. Results are shown as mean ± SD (n = 3). *P < .05, **P < .01, ***P < .001 based on Student t-test. b The total mRNA integrity was tested on the Agilent 2100 bioanalyzer used the Eukaryote Total RNA Nano assay. c Differentially expressed genes (2-fold) between mock and LV-POTEE RKO cells were determined by RNA-Seq and shown by volcano plot. d IPA z-score analysis. IPA z-score > 2 or < -2 was considered to be significant activation or inhibition. Analysis result showed that the IPA z-score of S1P signaling was 2.449. e Heat map showing the microarray result for the differentially expression genes involved in S1P pathway. Scale bar: red (upregulated), green (downregulated). f qRT-PCR was performed to examine seven upregulated genes involved in S1P molecules network in RKO cells with POTEE overexpression or mock cells. Results are shown as mean ± SD (n = 3). *P < .05, **P < .01, ***P < .001 based on Student t-test. g Histogram sort based on P-value, and the horizontal line represented actively classic pathway. h Heat map showing the microarray result for the differentially expression genes involved in NF-κB pathway. Scale bar: red (upregulated), green (downregulated). i Indicated upregulated 9 genes involved in NF-κB pathway measured by qRT-PCR. Results are shown as mean ± SD (n = 3). *P < .05, **P < .01, ***P < .001 based on Student t-test

