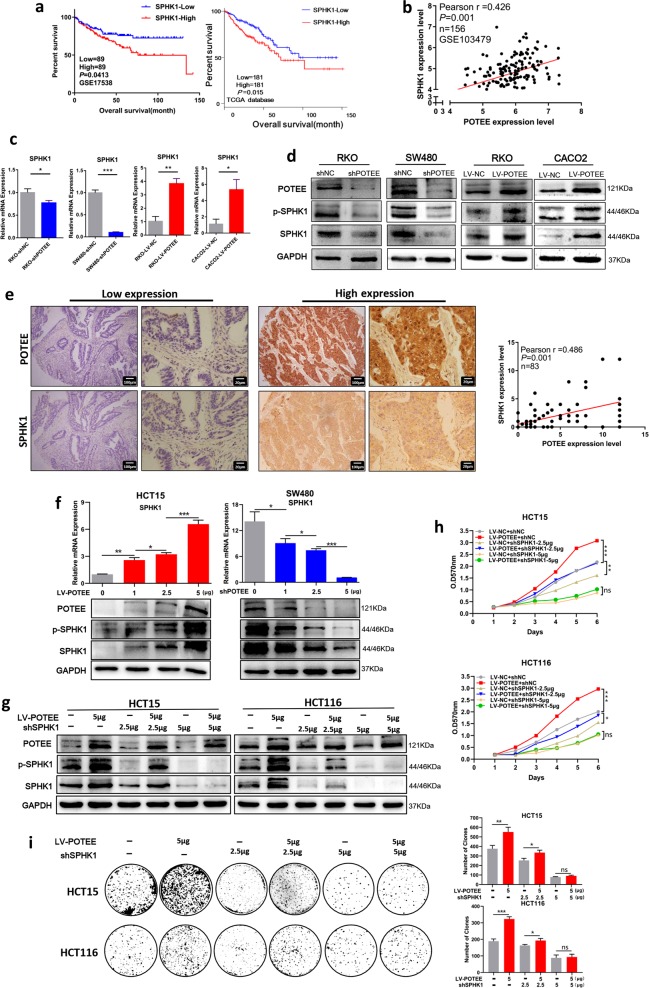
Fig. 4. POTEE facilitates proliferation through up-regulating SPHK1.
a Kaplan–Meier survival curves depicting overall survival of patients with CRC grouped by SPHK1 mRNA expression levels. Data were deposited to GSE17538 dataset (left) and TCGA database (right). b Correlation between mRNA expression of POTEE and SPHK1 based on Pearson χ2 test, data was deposited to GSE103479 dataset. c qRT-PCR was performed to detect mRNA level of SPHK1 in indicated cell lines. Results are shown as mean ± SD (n = 3). *P < .05, **P < .01, ***P < .001 based on Student t-test. d Total and phosphorylated levels of SPHK1 (p-SPHK1) were analyzed by western blotting in the cell lines with different POTEE expression. e. Identification of the correlation between protein levels of POTEE and SPHK1 in CRC tissues with IHC analysis. Statistics were measured by Pearson χ2 test. f qRT-PCR (up) and western blot (down) showing POTEE and SPHK1 expression in HCT15 and SW480 with different doses of overexpression and knockdown in POTEE. Results are shown as mean ± SD (n = 3). *P < .05, **P < .01, ***P < .001 based on Student t-test. g Western blot detected indicated proteins with different doses of knockdown in POTEE. h, i MTT (h) and colony formation assays (i) in cells with different POTEE and SPHK1 expression. Statistics were measured by 2-way ANOVA or Student t, *P < .05, **P < .01, ***P < .001

