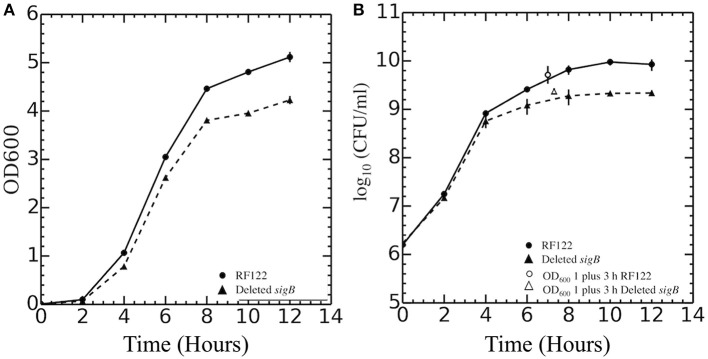
Figure 1.
Growth curves of Staphylococcus aureus RF122 and ΔsigB mutant strains. (A) Relationship between OD600 of each strain and time of incubation. (B) Relationship between log10 colony-forming units (CFU) per milliliter of each strain and time of incubation. The experiment was performed in three biological replicates.

