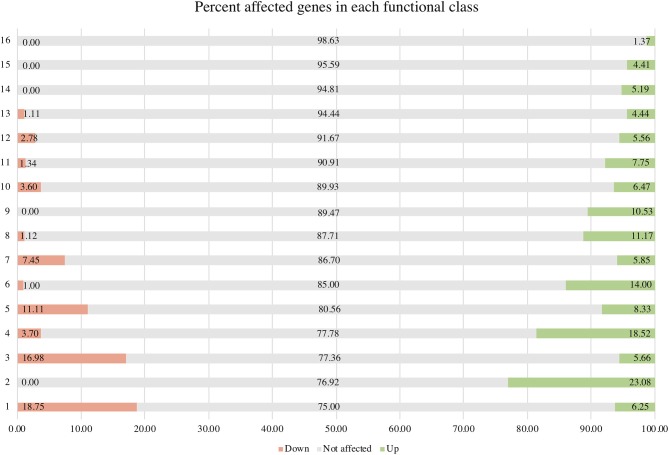
Figure 2.
Percentage of positively and negatively σB-regulated genes in each functional class. Functional classes: 1 = central intermediary metabolism; 2 = purines, pyrimidines, nucleoside, and nucleotides; 3 = amino acid biosynthesis; 4 = cellular processes; 5 = fatty acid and phospholipid metabolism; 6 = cellular proteins; 7 = transporter and binding proteins; 8 = cell envelope; 9 = transcription; 10 = energy metabolism; 11 = hypothetical protein; 12 = biosynthesis of cofactors, prosthetic groups, and carriers; 13 = regulatory functions; 14 = mobile and extrachromosomal element function; 15 = unknown function; and 16 = DNA metabolism.

