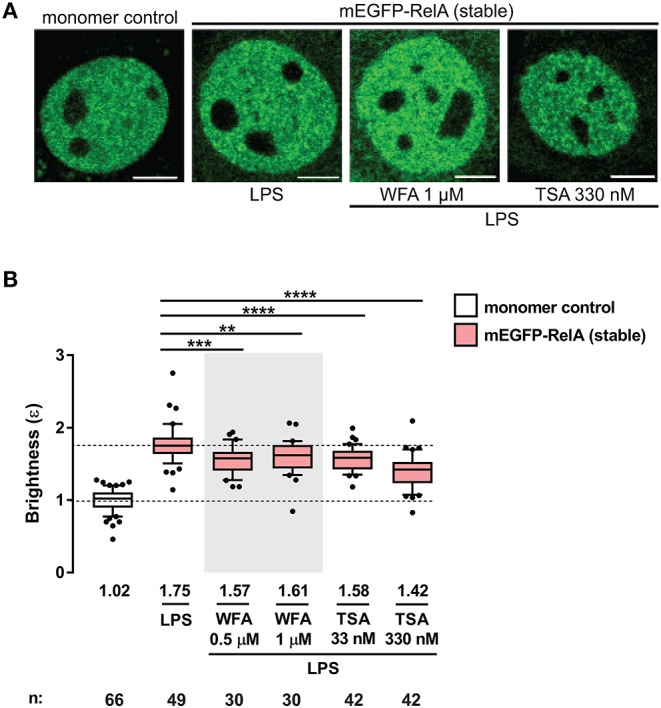
Figure 4.

Perturbation of RelA homodimers by pharmacological agents. (A) Representative confocal micrographs of nuclei in transiently- and stably-transfected 3T3 fibroblasts pre-incubated with WFA or TSA before LPS treatment (100 ng/mL). Control and LPS images are the same as those in Figure 2B. Image intensity scale was adjusted for optimal viewing. Scale bar: 5 μm. (B) Brightness (ε) values of nuclear RelA in fibroblasts under different conditions. Control and LPS samples are the same as those in Figure 2C. Data was obtained from at least two independent experiments performed on different days. Whiskers are drawn down to the 10th percentile and up to the 90th. Number of nuclei and median values of each sample are presented below each boxplot. Unpaired two-tailed Student's t-test (**p ≤ 0.01, ***p ≤ 0.001, and ****p ≤ 0.0001) was performed for statistical comparisons.
