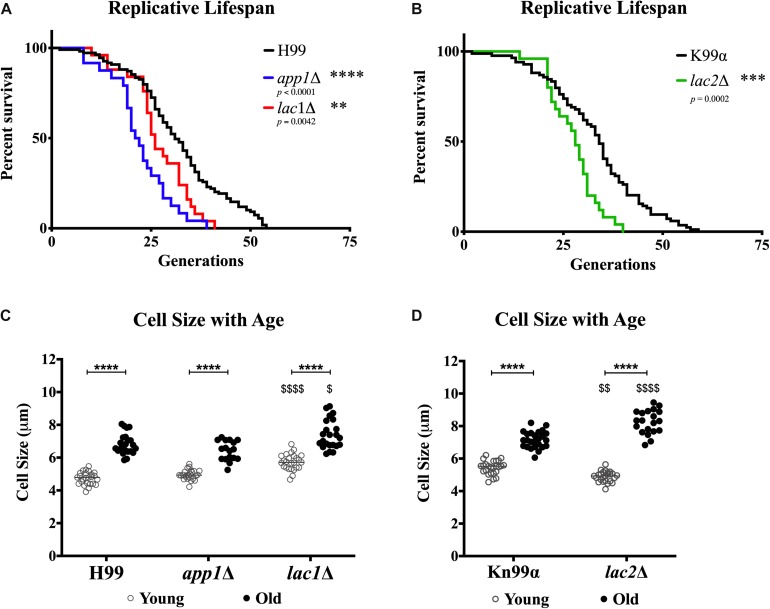
FIGURE 6.
Decreased lifespan of mutants and increased cell size with age. Replicative lifespans were determined for each mutant strain and compared to its respective wildtype (A,B). Cell sizes were measured in the young (0–3 generations) and old (10 generations) fractions of cells after separation to assess the cell size of each population (C,D). ∗∗p < 0.01, ∗∗∗p < 0.001, ∗∗∗∗p < 0.0001 by one-way ANOVA. $p < 0.05, $$p < 0.01, $$$$p < 0.0001 by one-way ANOVA compared to wildtype counterpart.

