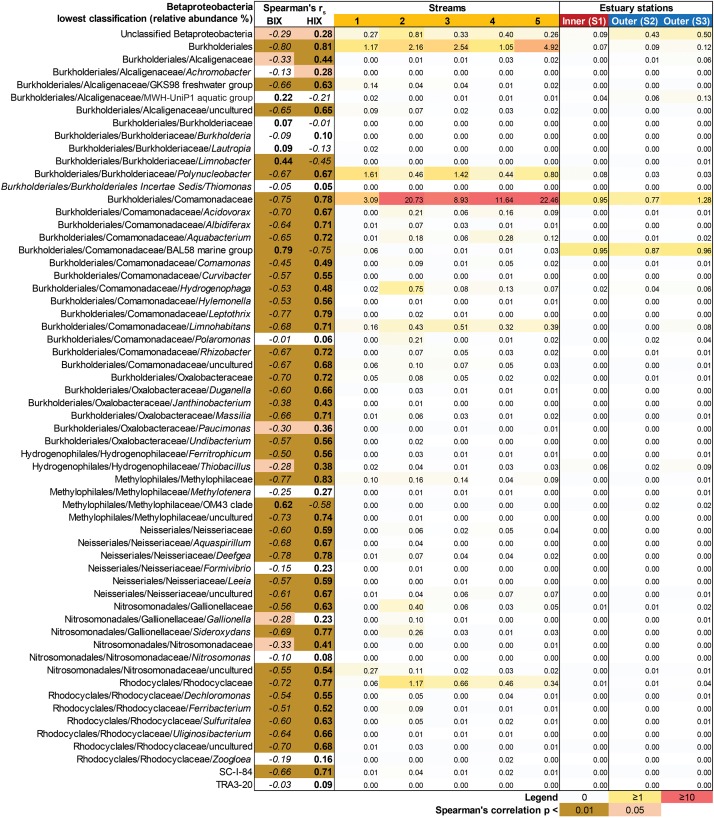
FIGURE 7.
Heatmap showing all Betaproteobacteria OTUs grouped into the lowest classifications (i.e., order, family, or genus). The heatmap (yellow–red color gradient) shows the relative abundance (%) of the whole prokaryotic community, with white to yellow (0–1%), yellow to red (1–10%), and red (≥10%). The columns show the average relative abundances of the samples from each study system (i.e., five streams and 1 m depth data used from the three stations in the estuary). The FDOM biological index BIX (i.e., autochthonous origin) and humification index HIX (i.e., allochthonous origin) were used in Spearman correlations with the Betaproteobacteria groups. The results are indicated in the columns BIX and HIX with brown colors (p < 0.01) and light brown (p < 0.05). The italic text denotes negative correlations and bold text denotes positive correlations.

