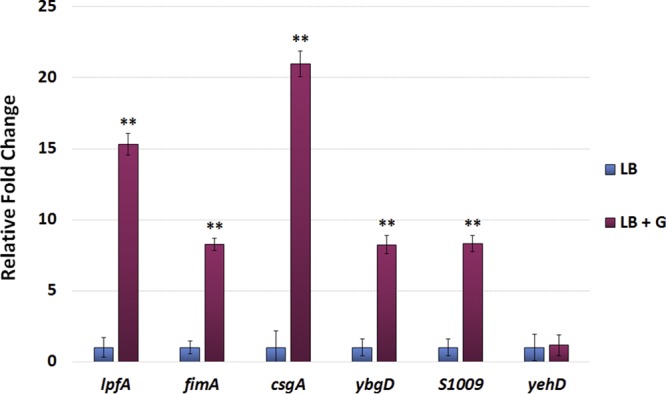
FIG 4.

Quantitative RT-PCR analysis of S. flexneri 2457T structural adherence genes. RNA was isolated from S. flexneri 2457T grown in medium (LB) or medium supplemented with 2% (wt/vol) glucose (LB + G). For each primer set, the relative fold change ± the standard error of the ΔCT value is plotted for each gene. Data represent the average for at least three biological independent samples, in which each sample had technical duplicates. yehD (Table 1) expression was not induced in the presence of glucose and therefore served as an internal negative control for the analysis. **, P ≤ 0.01 between LB and LB-glucose conditions.
