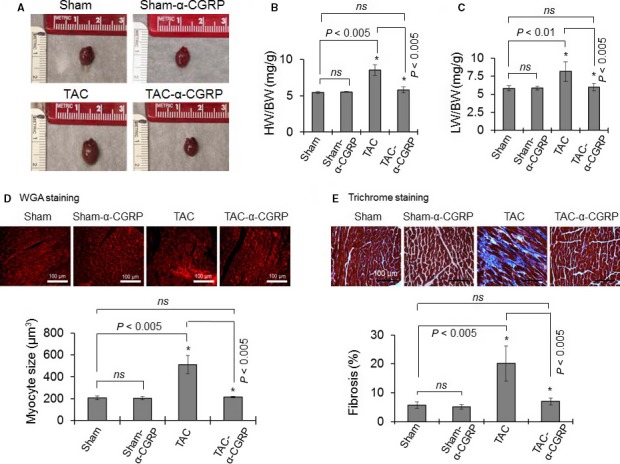
Figure 2.

(A) Representative photographs showing the size of the hearts of sham, sham‐α‐CGRP, TAC, and TAC‐α‐CGRP mice after 28 days α‐CGRP delivery. (B and C) Bar diagrams represent the ratio of wet heart weight/body weight (HW/BW), and wet lung weight/body weight (LW/BW). (D) The paraformaldehyde‐fixed, paraffin‐embedded LV sections (5 µm) were stained with WGA stain (upper panel). Cell size was measured by NIH‐ImageJ software and plotted (lower panel). Scale bar = 100 μm. (E) Trichrome‐collagen stained LV sections (upper panel) were used to measure fibrosis. Collagen content, an indicator of fibrosis, was quantitated by NIH‐ImageJ software and plotted (lower panel). Values were expressed as the mean ± SD. *P < 0.05 was considered significant. ns = non‐significant.
