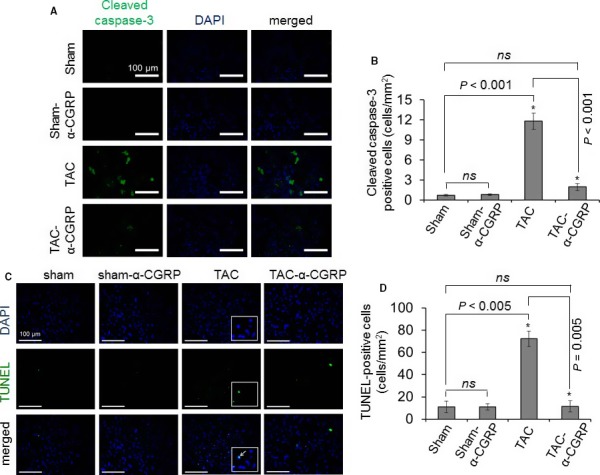
Figure 3.

Representative fluorescence images showing cleaved caspase‐3 staining (A) and TUNEL‐staining (C) to detect apoptosis in the LV sections. DAPI was used to stain nuclei. Cleaved caspase‐3 (cytoplasmic, green in color) and TUNEL‐positive cells (nuclear, green in color) were counted and plotted as the mean ± SD (B and D). Enlarged image boxes in TAC LVs were showing the overlapping of TUNEL‐DNA fragmentation staining and DAPI‐nuclear staining in a single cell (white arrow, Fig. 3C). Scale = 100 μm.*P < 0.05 was considered significant. ns = non‐significant.
