Figure 5.

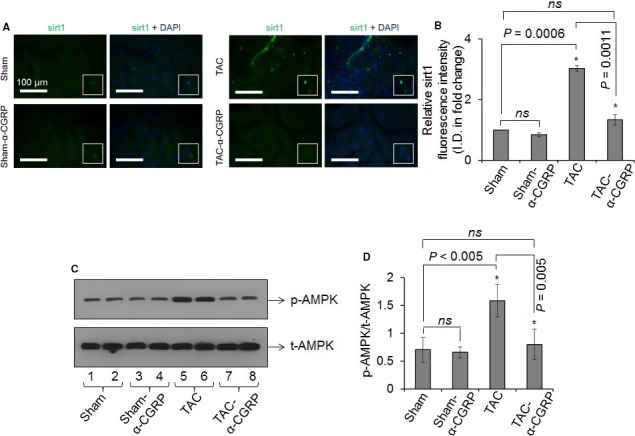
(A) Representative immunofluorescence images showing the nuclear staining of sirt1 (green) in the sham, sham‐α‐CGRP, TAC, and TAC‐α‐CGRP LV sections after α‐CGRP delivery (day 28). DAPI was used to stain nuclei. White boxes showed the enlarged area with sirt1 staining in the nucleus. Scale = 100 μm. (B) The sirt1 fluorescence intensity was quantitated by NIH‐ImageJ software and plotted as the mean ± SD. (C and D) Western blots showing the protein level of total‐ and phospho‐AMPK in the LV of sham, sham‐α‐CGRP, TAC, and TAC‐α‐CGRP mice after α‐CGRP delivery (day 28). The protein band intensity was quantitated and plotted as the mean ± SD. *P < 0.05 was considered significant. ns = non‐significant.
