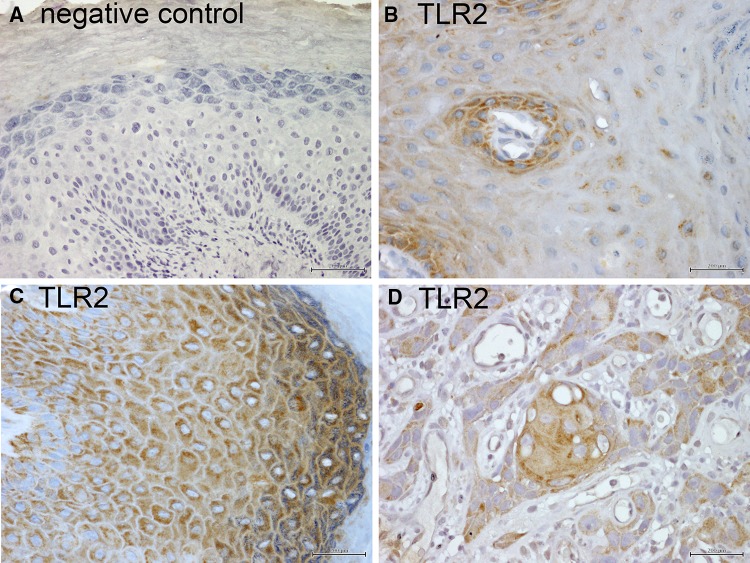
Fig. 3.
Close-up of patterns of TLR2 expression in oral keratinocytes. IHC for TLR2 was performed as described in “Materials and Methods”. All images are acquired at 200×. Brown: TLR2 stain; blue = hematoxylin counterstain. a Negative control. b Diffuse cytoplasmic TLR2 expression in basal keratinocytes, rapidly decreasing to occasional small perinuclear foci in the spinous layer. c Diffuse cytoplasmic expression of TLR2 in keratinocytes of all squamous epithelial layers. d Diffuse cytoplasmic TLR2 expression in malignant squamous cells of oral SCC

