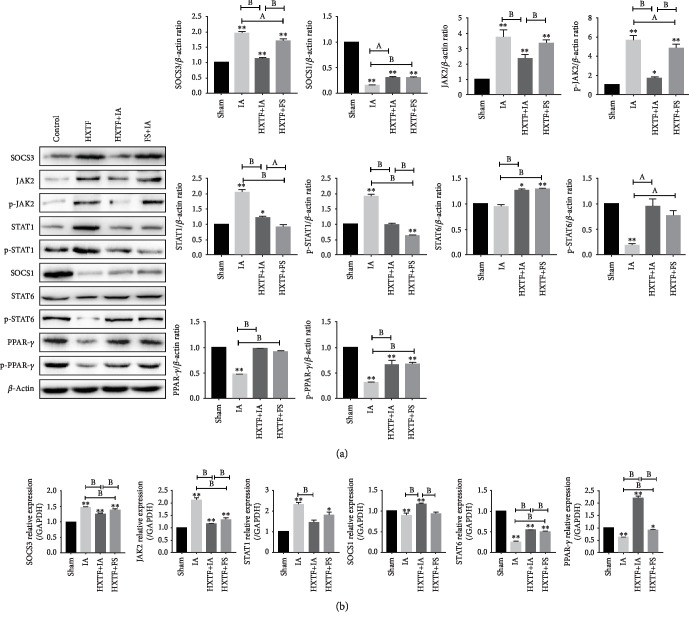
Figure 9.
Expression of the SOCS/JAK2/STAT/PPAR-γ pathway in intraperitoneal adhesion tissues. (a) Representative Western blot analysis showing SOCS/JAK2/STAT/PPAR-γ pathway protein expression levels. (b) Real-time PCR was used to quantify the relative levels of mRNA of SOCS/JAK2/STAT/PPAR-γ pathway-related factors. All values are expressed as mean ± S.E. (n = 10). ∗p < 0.05, ∗∗p < 0.01, ap < 0.05, and bp < 0.01, comparison of the designated two groups.

