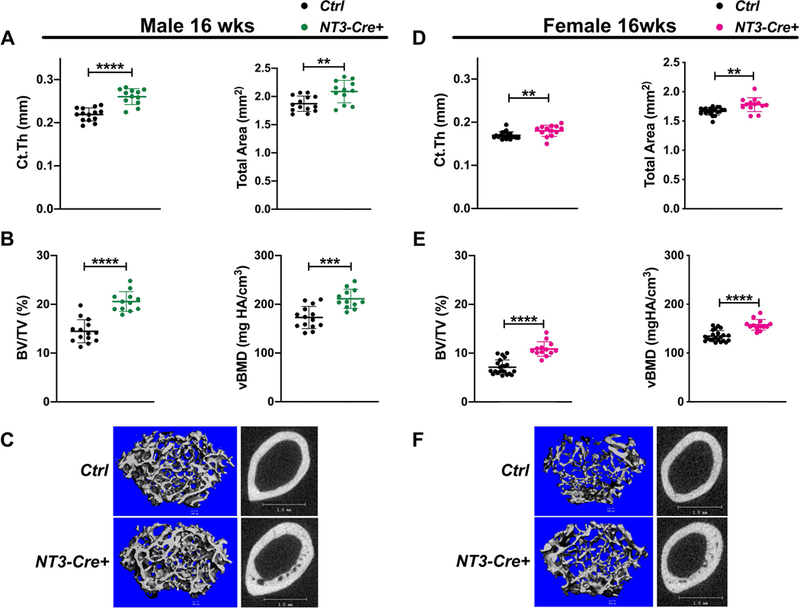
Figure 1: Basal bone mass is enhanced in both male and female NT3-Cre+ mice.

(A) MicroCT analysis (ex-vivo) of the femur in male mice at 16 wks showing increased cortical thickness and cortical total area in NT3 transgenic mice. n=12–14 per group; black circles = male Ctrl and green circles = male NT3-Cre+. (B) Cancellous BV/TV and vBMD are higher in male NT3-Cre+ animals. (C) Representative images for cancellous (left) and cortical (right) femoral bone indicating heightened bone mass in male NT3-Cre+ mice. (D) MicroCT analysis (ex-vivo) of the femur in female mice at 16 wks also shows increased cortical thickness and cortical total area in NT3 transgenic mice. n=13–22 per group; black circles = female Ctrl and pink circles = female NT3-Cre+. (E) Cancellous BV/TV and vBMD are also elevated in female NT3-Cre+ animals. (F) Representative images for cancellous (left) and cortical (right) femoral bone illustrating greater bone mass in female NT3-Cre+ mice. Data are represented as mean ± SD. Unpaired, student’s two-tail t-test: *p<0.05, **p<0.01, ***p<0.001, ****p<0.0001. Ct.Th = cortical thickness; BV/TV = bone volume/total volume; vBMD = volumetric bone mineral density
