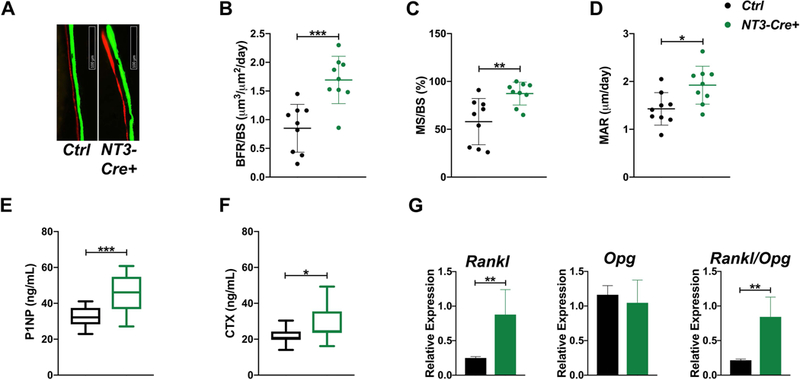
Figure 2: Both osteoblast and osteoclast activity are upregulated in NT3-Cre+ mice.

(A) Representative images of calcein and alizarin 5-day double-labeling for each genotype at 6 wks. (B) Dynamic histomorphometry at the tibial endocortical surface shows increased BFR/BS, (C) MS/BS, and (D) MAR in 6-wk-old NT3 transgenic animals (n=9–10 per group). Serum P1NP (E) and CTX (F) levels are markedly elevated in 12-wk-old NT3-Cre+ mice (n=12–15 per group). (G) qPCR showing increases in Rankl expression and the Rankl/Opg ratio in flushed, crushed bone of 12-wk-old NT3-Cre+ mice (n=4–7 per group). Results are presented as mean ± SD. black = male Ctrl and green = male NT3-Cre+. Unpaired, student’s two-tail t-test: *p<0.05, **p<0.01, ***p<0.001. BFR/BS = bone formation rate per bone surface; MS/BS = mineralizing surface per bone surface; MAR = mineral apposition rate; OPG (Tnfrsf11b); RANK (Tnfrsf11a); RANKL (Tnfsf11).
