
Figure 4: RNAseq analysis reveals two main transcriptional programs: one loading-responsive and the other driven by the NT3 transgene.
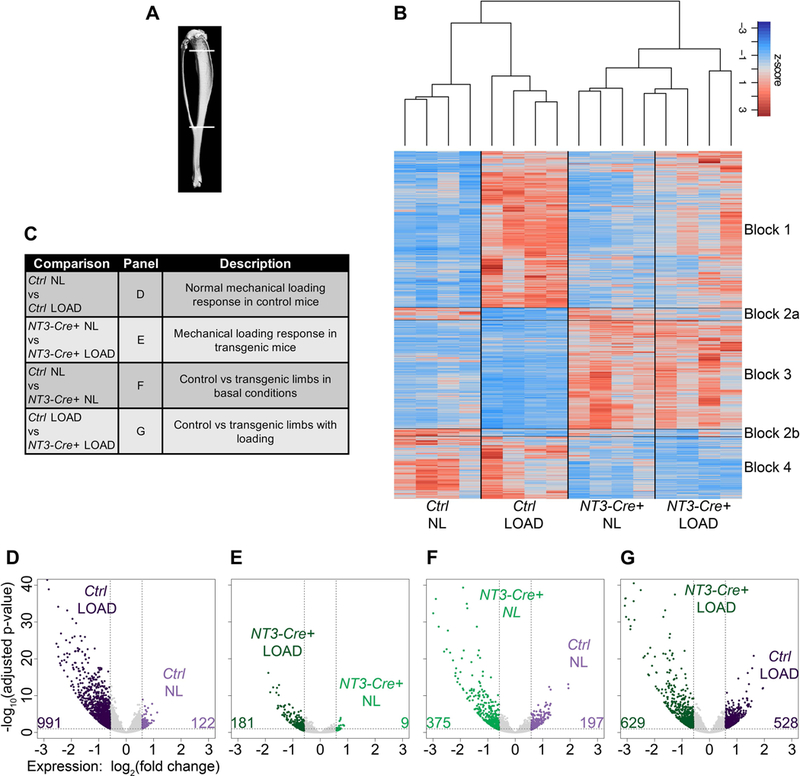
(A) Schematic representing the tibial region of interest harvested for RNA-Seq analysis (top line: 2 mm distal to the articular surface and bottom line: distal tibia-fibula junction). (B) Heatmap displaying z-scores across all samples highlighting two main transcriptional programs: one induced by loading (blocks 1–2) and the other by the NT3 transgene (blocks 3–4). (C) Table listing RNAseq analysis comparisons and description of resulting differentially expressed genes (DEGs). (D-G) Volcano plots for each of the comparisons in (C) showing number of upregulated DEGs in each pairwise comparison. DEGs were defined as having a fold-change > 1.5 together with an adjusted p-value ≤ 0.05. n=4 per genotype/loading condition. light purple = Ctrl NL; dark purple = Ctrl LOAD; light green = NT3-Cre+ NL; dark green = NT3-Cre+ LOAD