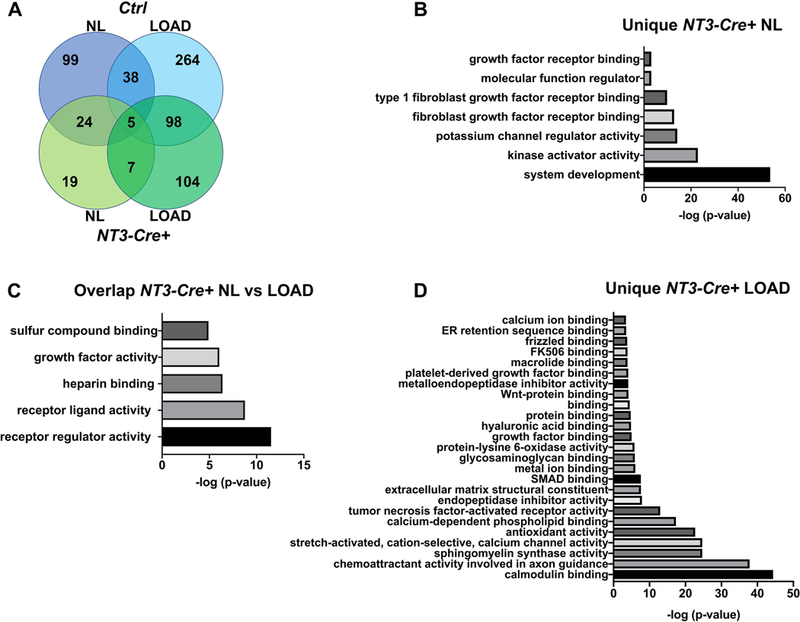
Figure 5: Gene ontology analysis reveals a bone anabolic signature in NT3-Cre+ mice.

(A) Venn diagram for the gene ontology (GO) analysis of molecular function across all 4 experimental groups using a multi-way partitioning algorithm. The number of unique GO terms is listed for each bin. The top GO terms (p<10−3) in NT3-Cre+ mice unique to the (B) NL side or (C) shared between loading conditions is enriched for receptor, kinase, and growth factor activities. (D) Top GO terms unique to NT3-Cre+ loaded tibiae indicate involvement of calcium signaling. NL = non-loaded tibia; LOAD = loaded tibia
