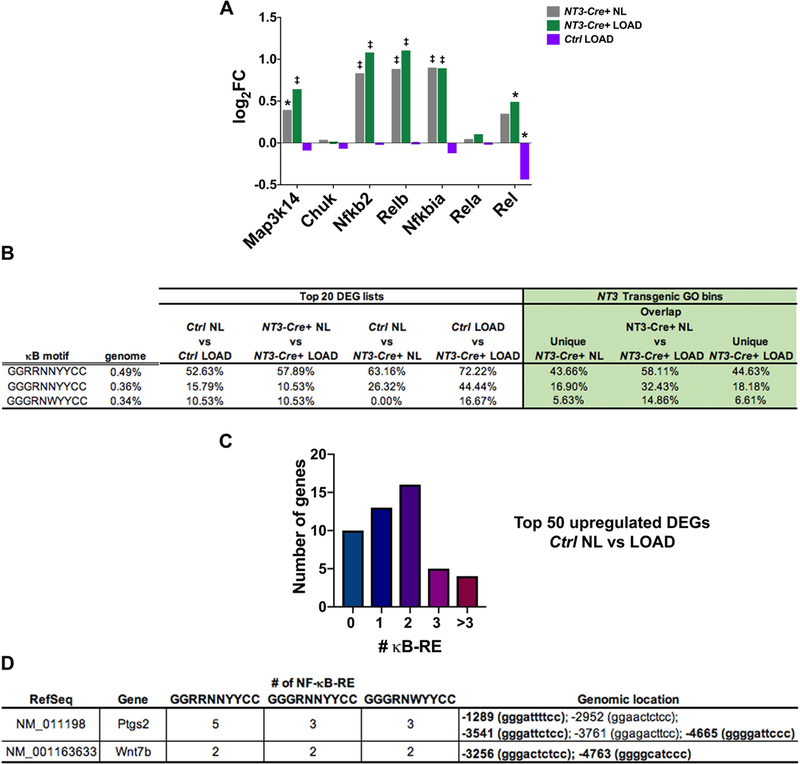
Figure 7: κB-RE are enriched in response to the NT3 transgene and with loading.

(A) Log FC for each genotype and/or loading condition compared to Ctrl NL samples for NF-κB signaling pathway components. Significance (adjusted p-value): *p<0.05, ‡p<0.0001. (B) (left) Incidence of genes with ≥2 κB recognition elements (κB-RE) in the top 20 upregulated DEG lists and (right) NT3 transgenic GO bins is much higher than the background frequency in the genome in both loading and NT3 transgene settings. Genome background frequency is defined as the probability of at least 1 out of 121 randomly selected genes (size of largest NT3 transgenic GO bin) containing ≥2 κB-RE in 10 million iterations. (C) Number of genes with the indicated number of κB-RE in the top 50 Ctrl NL vs LOAD upregulated DEG list, indicating an enrichment of κB-RE in the normal loading response. (D) Both Ptgs2 and Wnt7b contain multiple κB-RE. Genomic coordinates are listed relative to the transcription start site (position zero). Bold genomic location indicates sequence is found across all 3 motifs tested. R = A/G; N = A/G/C/T; Y= C/T; W = A/T
