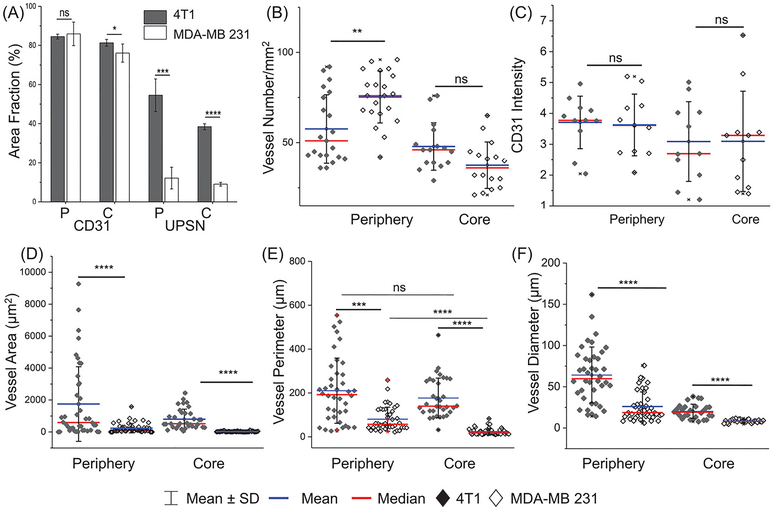
Figure 6. Image analysis of tumor histology.
(A) Quantification of CD31 and UPSN-FITC signal from confocal micrographs (area fraction percentage) of periphery and core of 4T1 and MDA-MB 231 tumors. Comparison of (B) vascular densities (number of blood vessels/mm2), (C) intensity of CD31 expression, (D) area of blood vessels, (E) perimeter of blood vessels, and (F) diameter ((calculated as geometric mean over 4 measurements of individual blood vessel), in the tumor periphery and core, for the two models. Each data point represents average value over one field of view. Atleast 6 fields each for tumor periphery and core were imaged per sample in both 4T1 and MDA-MB 231 groups. (n = 3) *p < 0.05, ** p < 0.01, ***p < 0.001, ****p < 0.0001, ns = non-significant (p > 0.05).

