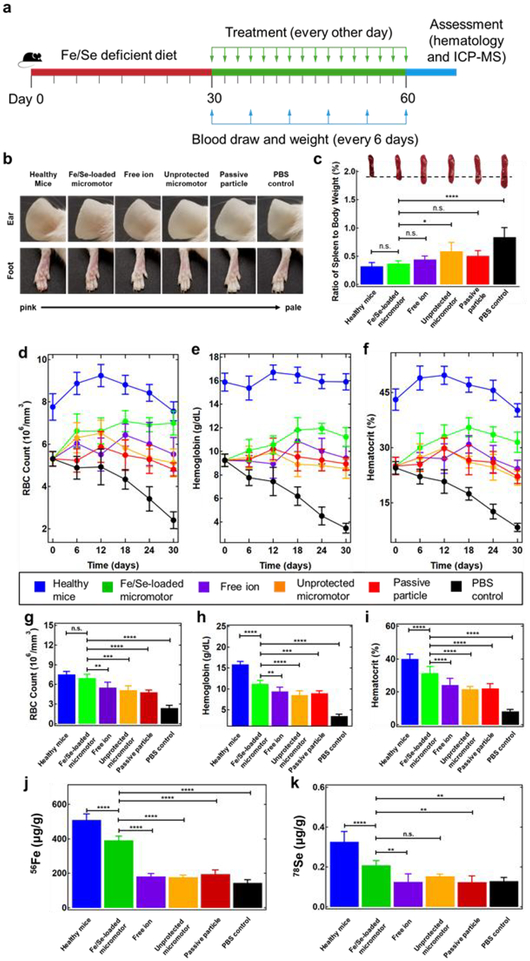
Figure 3.
Active mineral replenishment with Fe/Se-loaded micromotors. a, The study protocol for evaluating treatment efficacy of Fe/Se-loaded micromotors using an anemic mouse model. Anemia was induced by feeding mice with Fe and Se deficient diet for 30 days (red line). Subsequently, the mice treatment was performed for 30 days (green line) with micromotor and control administration every other day (green arrows). Blood draw and weighing of the mice were performed every 6 days during the treatment period (blue arrows). Images of mice, hematology and ICP-MS measurements were carried out at the end of the study (blue line). b, Representative images of mouse ears (top) and feet (bottom) demonstrating differences in coloration and vein visibility among the six tested groups. c, Ratio of spleen weight to total body weight of mice treated with the six tested groups. Inset images show a representative spleen from each group, highlighting the changes in spleen color and size. d-f, RBC count (106 cells/mm3) (d), hemoglobin levels (g/dL) (e), and hematocrit (%) (f) of each group of mice were measured and monitored for 30 days over the entire treatment period. g-i, RBC (106 cells/mm3) (g), hemoglobin (g/dL) (h) and hematocrit (%) (i) of each group of mice quantified at the endpoint of the treatment (on day 30). j, k Elemental 56Fe (μg/g) (j) and 78Se (μg/g) (k) content of whole blood for each group of mice, quantified by ICP-MS at the endpoint of the treatment (on day 30). Each group had n = 5 mice. Statistical analysis was performed using one-way ANOVA (error bars are defined as mean ± SD).

