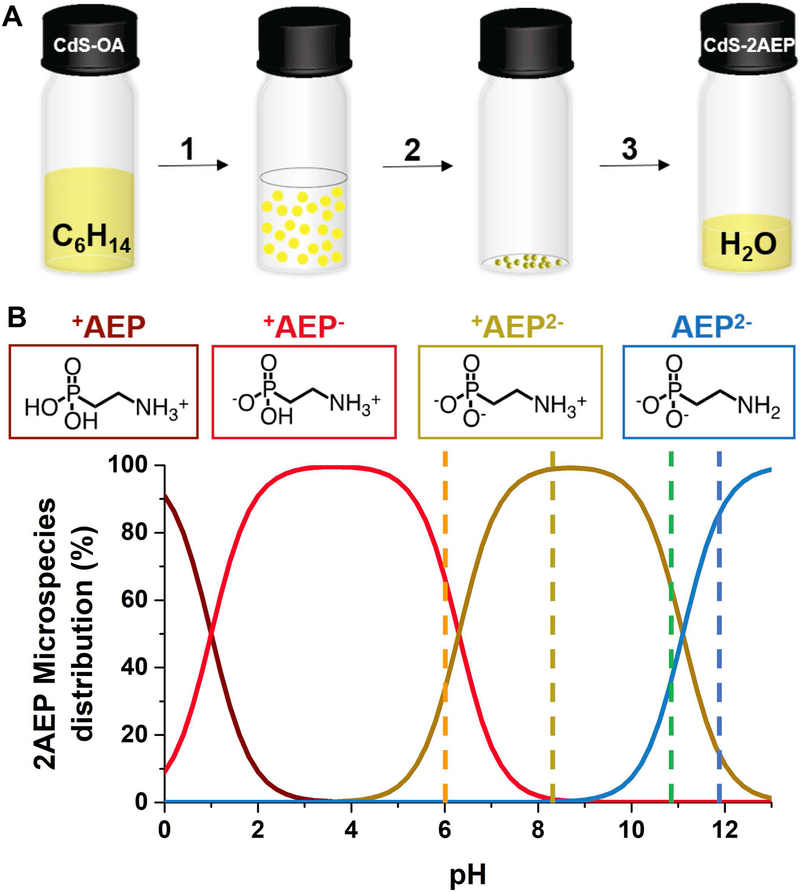
Figure 1.
A) Schematic diagram of the ligand exchange procedure: (1) add 75 μL of a methanolic solution of 0.04 M AEP and 0.1 M KOH (a molar ratio KOH:AEP of 3:1) to 9∙10−7 M CdS QDs in hexanes; (2) mix rapidly, centrifuge at 9500 RPM for 5 minutes and remove the colorless hexanes layer; (3) add 3 mL of (i) DI water to achieve a pH of 10.8, (ii) 2 mM HCl (aq.) to achieve a pH of 6, (iii) 1 mM HCl (aq.) to achieve a pH of 8.2, or (iv) 5.6 mM KOH (aq.) to achieve a pH of 11.8. B) Fractional distribution of each AEP microspecies as a function of pH.

