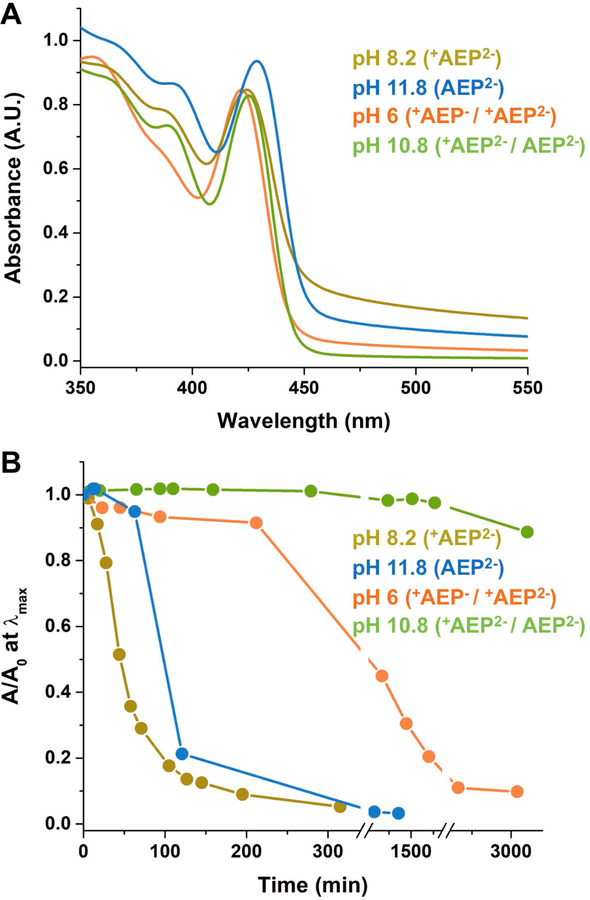
Figure 2.
A) Absorption spectra of AEP-capped CdS QDs at pH 6 (orange), pH 8.2 (dark yellow), pH 10.8 (green) and pH 11.8 (blue). B) Absorbance at the energy of the first excitonic peak as a function of time scaled by its value at time zero (A0) of the same set of samples as in A. In both panels, the legend lists the pH values of the samples in order of increasing colloidal stability, and shows the dominant protonation state(s) of the AEP ligand at that pH.

