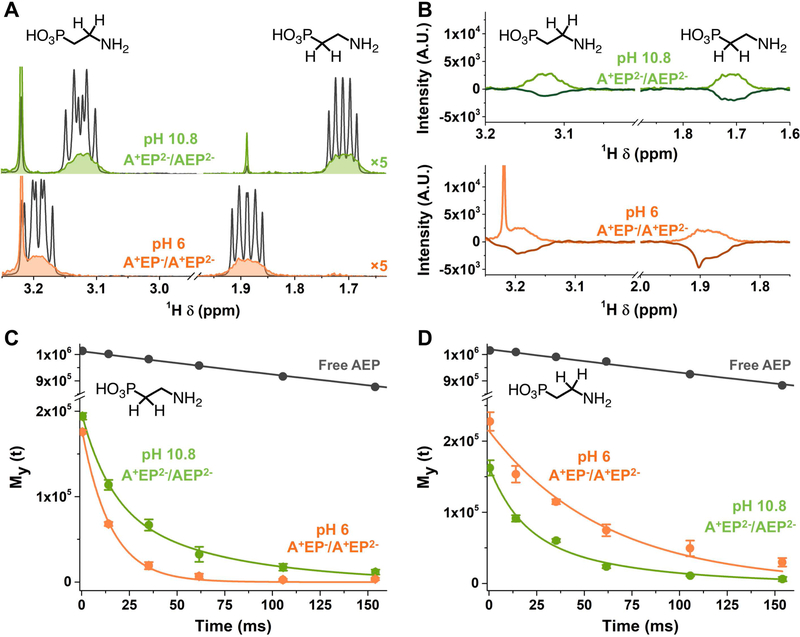
Figure 3.
A) 1H-NMR spectra of AEP-capped CdS at pH 6 (orange) and pH 10.8 (green) and of AEP when no QDs are in solution (grey). B) 1H-NMR and 1D-NOESY spectra of AEP-capped CdS at pH 6 (light and dark orange) and pH 10.8 (light and dark green). C) T2 exponential decay and associated curve fits of resonances adjacent to the phosphonate group at pH 6 (orange, monoexponential fit) and pH 10.8 (green, biexponential fit). D) T2 exponential decay and associated curve fits of resonances adjacent to the amino group at pH 6 (orange, monoexponential fit) and pH 10.8 (green, biexponential fit). All the peak integrals used to plot these decays are averaged among 3 experiments.

