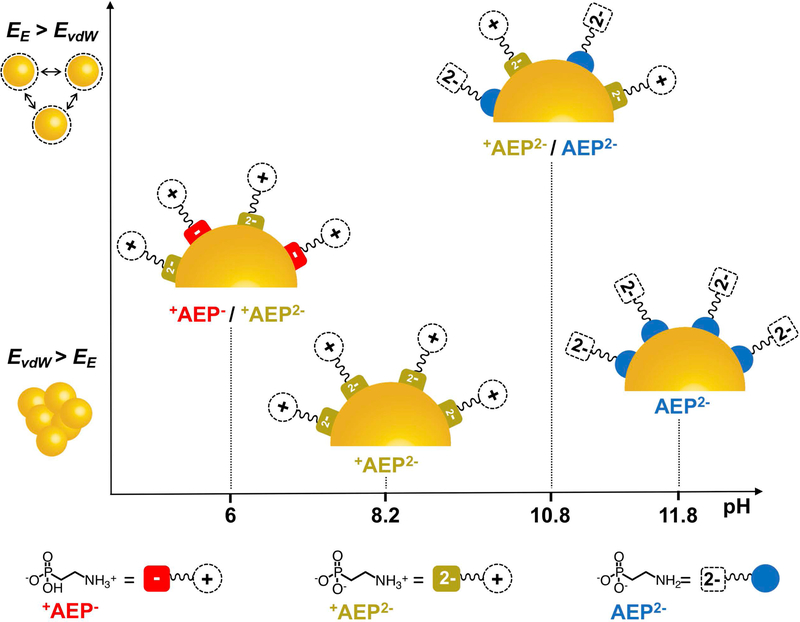
Figure 4.
Schematic of the ligand binding motifs for AEP-capped CdS QDs in water for the four pH values we studied: 6, 8.2, 10.8, and 11.8, derived from optical and NMR data. Figure 2B shows the timescales of precipitation for the particles at various pH values; here the particles are ordered from top (most stable, pH 10.8) to bottom (least stable, pH 8.2) EE ≡ electrostatic force; EvdW ≡ vdW attractive energy between the particles.

