
Figure 3.
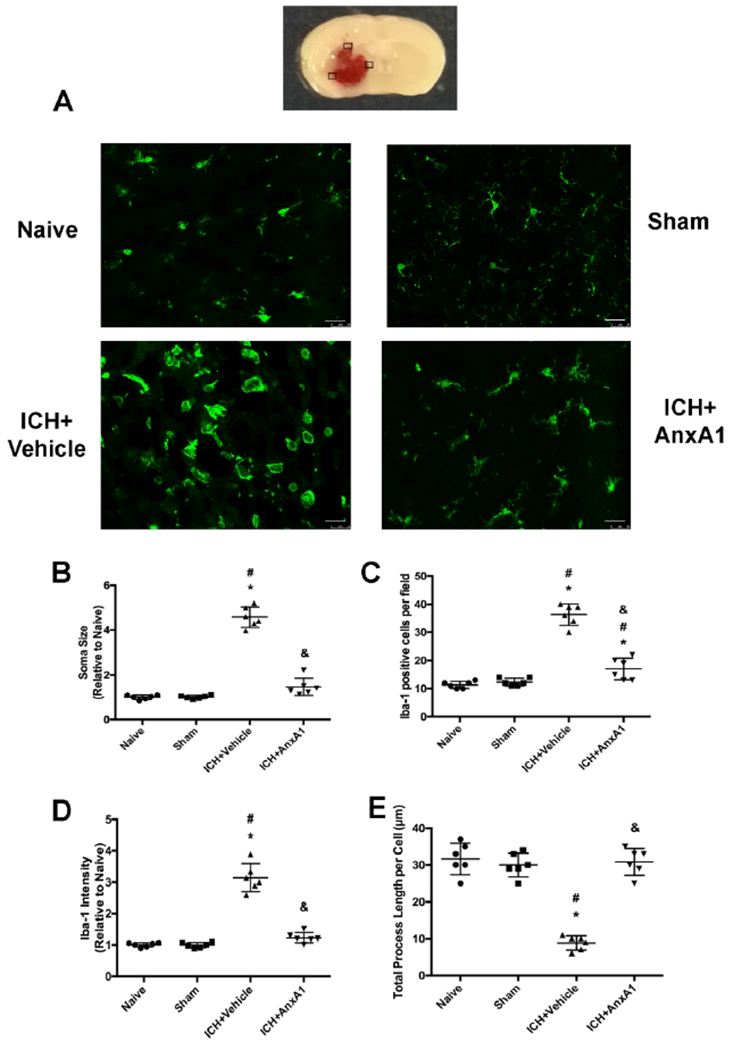
Microglial activation in the perihematoma area of the brain at 24 hours after ICH. Microglia were stained with Iba-1 (red). A) Representative images of each experimental group. B) Soma size of microglia. C) Numbers of Iba-1 positive cells per field. D) Iba-1 fluorescence intensity. E) Total process length per cell (μm). Scale bar = 25μm. *p<0.05 vs. naïve, #p<0.05 vs. sham, & p<0.05 vs. vehicle. Error bars are represented mean ± SD. One-way ANOVA, Tukey’s test, n=6 per group.