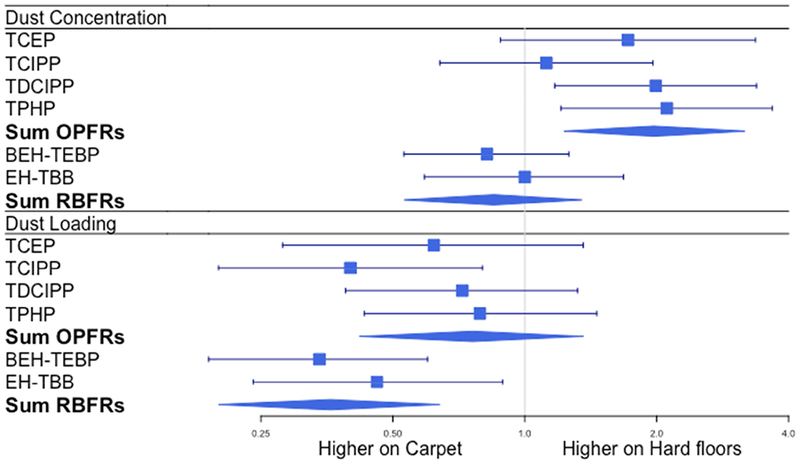
Figure 3:

Adjusted ratios and 95% confidence intervals for floor type variable (hard floor vs. carpet) in regression models of chemical dust concentrations and chemical dust loadings. Values <1 indicate higher chemical values for carpeted floors, and values >1 indicate higher chemical values for hard floors. Adjusted for age, income, smoking, race, education, year of dust collection, and visible cleanliness.
