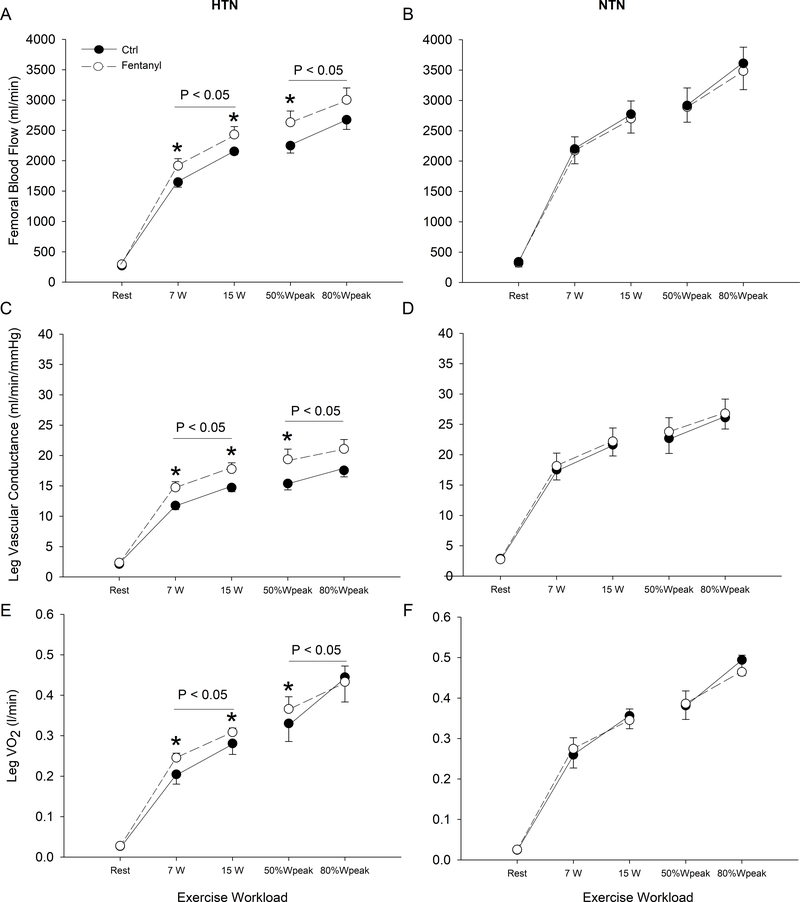
Figure 3. Femoral blood flow, leg vascular conductance, and leg VO2 at rest and during the final minute of each work rate performed under control (CTRL) and Fentanyl conditions in hypertensive (HTN) and normotensive (NTN) participants.
During CTRL exercise at the same absolute and relative work rates, femoral blood flow, leg vascular conductance, and leg VO2 were lower in HTN compared to NTN (P < 0.05). P values on graph indicate main effect of fentanyl. *P < 0.05 vs. CTRL.

