. 2019 Sep 25;36(3):167–173. doi: 10.5511/plantbiotechnology.19.0805a

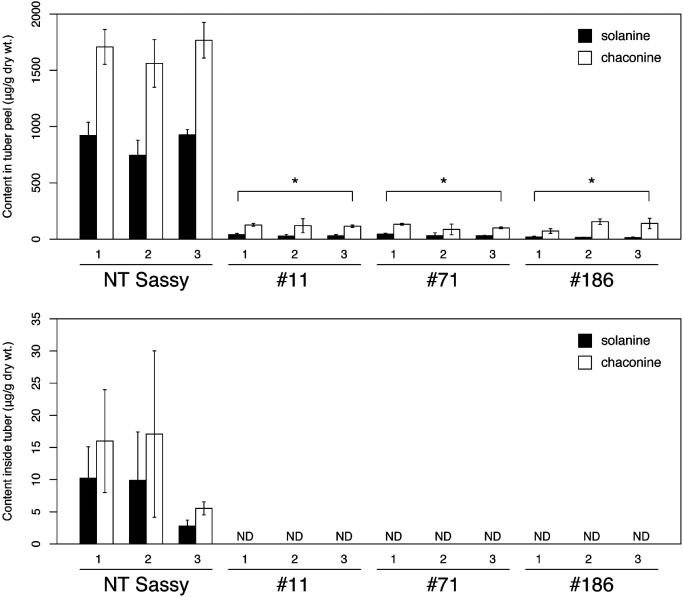
Figure 3. SGA contents of tubers from SSR2-edited transgenic potatoes. The predominant SGA levels in the tuber peels and in the tissues of the non-transgenic (NT) Sassy and SSR2-edited transgenic lines (#11, #71, #186). Three potato tubers were analyzed for each line. Error bars indicate the SD of three technical replicates. Asterisks indicate values significantly different from the NT (Dunnett’s test, p<0.001). ND, Not detected.

Figure 3. SGA contents of tubers from SSR2-edited transgenic potatoes. The predominant SGA levels in the tuber peels and in the tissues of the non-transgenic (NT) Sassy and SSR2-edited transgenic lines (#11, #71, #186). Three potato tubers were analyzed for each line. Error bars indicate the SD of three technical replicates. Asterisks indicate values significantly different from the NT (Dunnett’s test, p<0.001). ND, Not detected.