. 2019 Sep 25;36(3):181–185. doi: 10.5511/plantbiotechnology.19.0814a

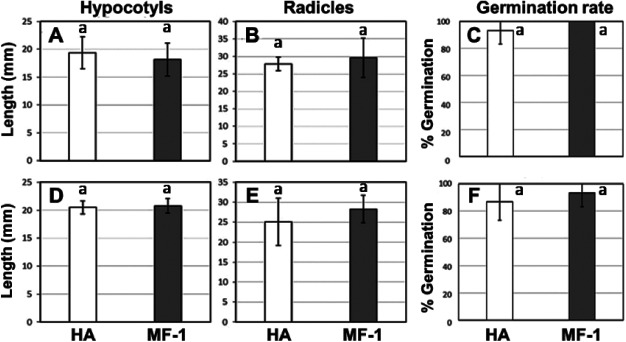
Figure 3. Allelopathic evaluation using the sandwich method and soil-mixed method for transgenic Oncidium “Honey Snow” MF-1. (A–C) Results of sandwich method. The hypocotyl and radicle growth rates and the germination rate of lettuce seedling grown in agar sandwiching 100 mg of dried leave were shown in A, B, and C, respectively. (D–E) Results of soil-mixed method. The hypocotyl and radicle growth rates and the germination rate of lettuce seedling grown in 100 g of soil mixing containing 1 g of dried leave were shown in D, E, and F, respectively. Dark grey bar represents transgenic Oncidium “Honey Snow” MF-1, while light bars represent non-transgenic Oncidium “Honey Angel.” Each graph shows the mean and S.E. of the measurements obtained from 10 lettuce seedlings. ANOVA did not show any significant difference between non-transformants and transformants.

Figure 3. Allelopathic evaluation using the sandwich method and soil-mixed method for transgenic Oncidium “Honey Snow” MF-1. (A–C) Results of sandwich method. The hypocotyl and radicle growth rates and the germination rate of lettuce seedling grown in agar sandwiching 100 mg of dried leave were shown in A, B, and C, respectively. (D–E) Results of soil-mixed method. The hypocotyl and radicle growth rates and the germination rate of lettuce seedling grown in 100 g of soil mixing containing 1 g of dried leave were shown in D, E, and F, respectively. Dark grey bar represents transgenic Oncidium “Honey Snow” MF-1, while light bars represent non-transgenic Oncidium “Honey Angel.” Each graph shows the mean and S.E. of the measurements obtained from 10 lettuce seedlings. ANOVA did not show any significant difference between non-transformants and transformants.