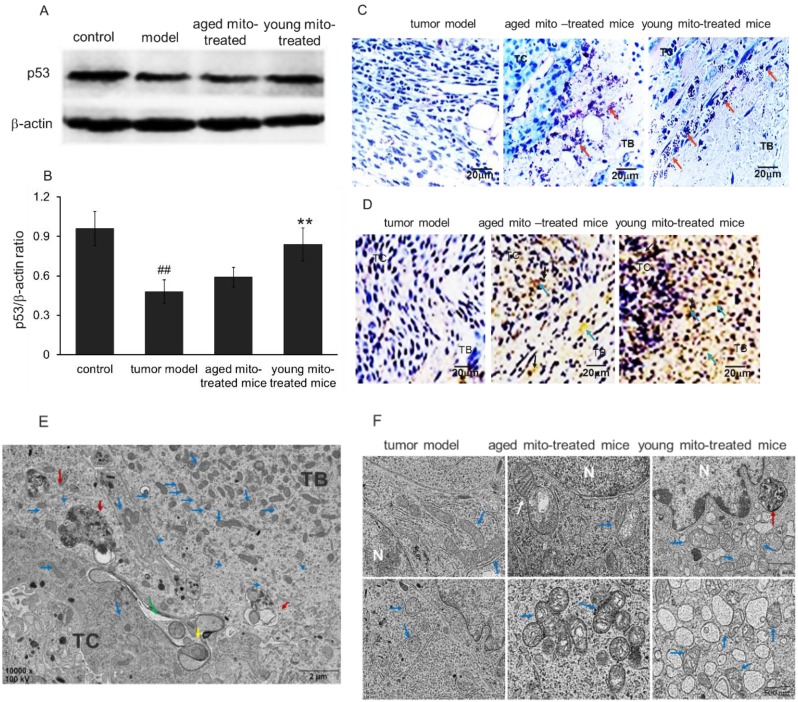
Figure 8.
Mitochondria induced cell death via apoptosis and necrosis pathways. (A), western blot analysis of p53 protein expression in tumor model, and treated with aged and young mitochondria. (B), the qualitative results of western blot analysis demonstrated that p53 expression was reduced in tumor model, but increased almost to the control level by young mitochondria reatment **p < 0.01. In addition, cell apoptosis was measured by POD (C) and TUNEL staining (× 100) (D). TC, tumor central; TB, tumor boundary. The TUNEL-positive cells were developed by DAB (brown color). The nuclei were stained by hematoxylin. The black arrows point to apoptotic cells. (E), TEM observation of mitochondria in melanoma cells after mitochondrial administration. Low magnification images of TEM showed the overall morphology of mitochondria and cells. Mitochondria mainly concentrated in TB and diffused to TC, and several macroautophagosome appeared in the cells. (F), cell morphology and mitochondria in the three groups of tumor model, aged and young mitochondria. Blue arrows point to intracellular mitochondria, the yellow to mitochondria at the cell boundary, and the green to mitochondria in intercellular spaces. The red arrows point to autophagosomes, and the white to fission mitochondria.

