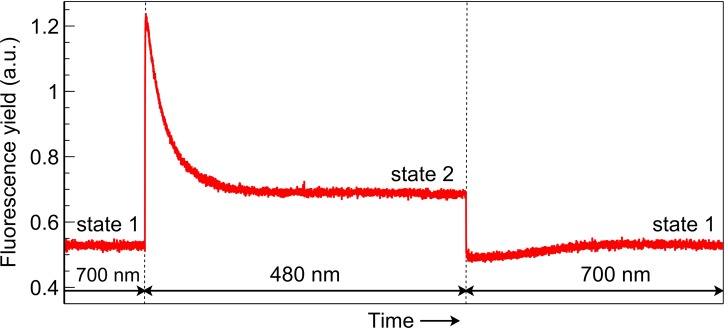
Figure 7. Fluorescence yield associated with transitions between state 1 and state 2.
Segment of fluorescence yield trace obtained with a SUN leaf and bearing classical hallmarks of a state transition. Fluorescence yield changes abruptly upon light switching and subsequent increases or decreases to a new steady state as a state transition proceeds.

