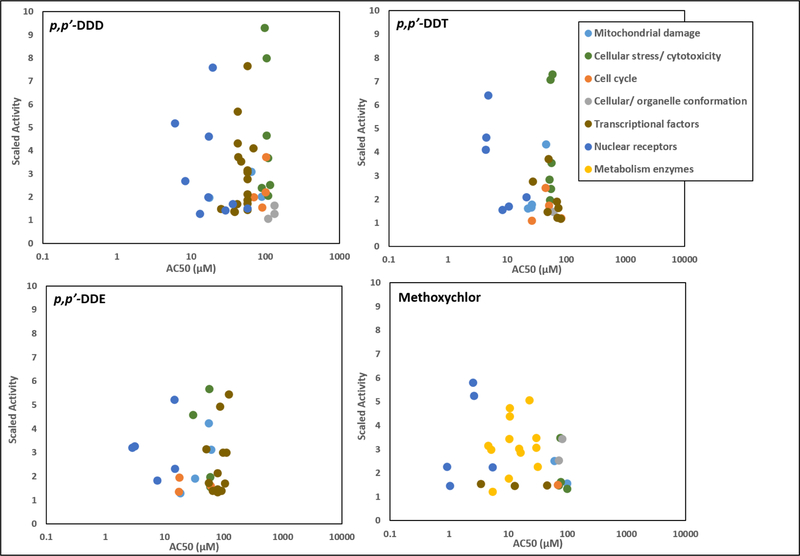
Figure 3. Bioactivity data for p,p’-DDD and Analogues in ToxCast Assays Conducted in Human Hepatoma HepG2 Cells and Primary Human Hepatocytes.
Scatterplots show AC50 and scaled activity values for p,p’-DDD, p,p’-DDT, p,p’-DDE and methoxychlor from in vitro assays visualized according to the type of biological response or biological target. AC50 values refer to the concentration that elicits half maximal response and the scaled activity refers to the response value divided by the activity cutoff (U.S. EPA, 2015). Metabolism enzyme-related assays were conducted in human primary hepatocytes and all other in vitro assays were measured in HepG2 cells. Assays for which chemicals were inactive are not displayed. Further information on AC50 values for individual assays can be found in Table A-3.

