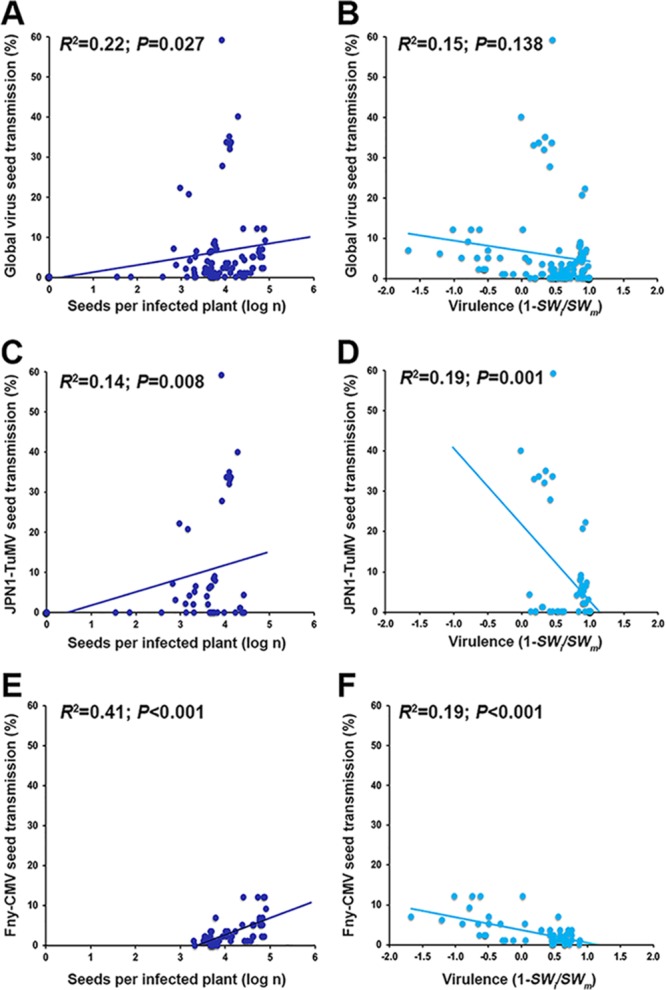
FIG 4.

Bivariate relationships between the main predictors of the number of virus-infected seeds. Regressions considering data for both viruses together (A and B), only JPN1-TuMV (C and D), and only Fny-CMV (E and F) are shown. Linear relationships of percent infected seeds and log number of seeds per infected plant (dark blue) and of percent infected seeds and virulence as 1 − (SWi/SWm) (light blue) are represented.
