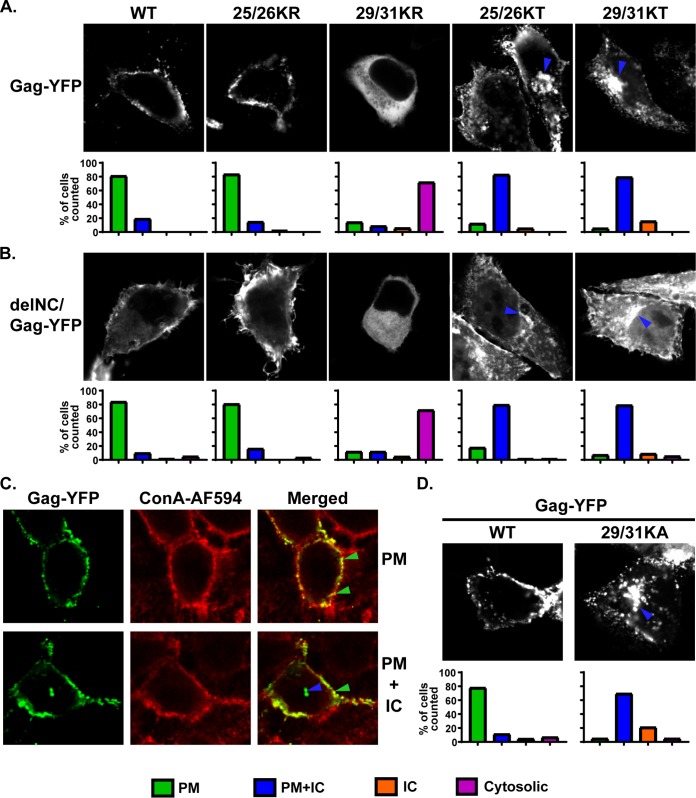
FIG 3.
Gag derivatives containing KR substitutions in the MA-HBR do not show promiscuous localization in cells, unlike those with KT changes. (A and B) HeLa cells were transfected with full-length Gag-YFP (A) and delNC/Gag-YFP (B), which contain the WT MA sequence or 25/26KR, 25/26KT, 29/31KR, or 29/31KT. At 14 h posttransfection, cells were stained with Alexa Fluor 594-conjugated concanavalin A (ConA-AF594), fixed with 4% paraformaldehyde in PBS, and analyzed using a fluorescence microscope. Note that subcellular distributions of delNC/Gag-YFP constructs mirror those of the corresponding full-length Gag-YFP constructs for both WT and MA-HBR mutants. Forty-two to 85 cells were analyzed under each condition across 3 independent experiments. The localization patterns determined by epifluorescence microscopy were confirmed by confocal microscopy. (Top) Representative confocal images. The blue arrowhead indicates the Gag-YFP signal in the intracellular compartments (IC). (Bottom) Bar graphs representing percentages of cells showing the indicated patterns of subcellular distribution for each Gag-YFP construct. ConA-AF594 staining was used as a plasma membrane (PM) marker (not shown). (C, top) Images showing an example of Gag-YFP showing PM-specific localization and ConA-AF594 staining of the PM. Green arrowheads indicate overlap of the two signals at the cell surface in a merged image. (Bottom) Images showing an example of Gag-YFP exhibiting PM and IC localization. The blue arrowhead indicates the Gag-YFP signal in the intracellular compartments. (D) HeLa cells were transfected with full-length WT Gag-YFP or 29/31KA Gag-YFP. At 16 h posttransfection, cells were stained with ConA-AF594, fixed with 4% paraformaldehyde in PBS, and analyzed using a fluorescence microscope. A total of 45 to 62 cells in 3 independent experiments were analyzed. The localization patterns determined by epifluorescence microscopy were confirmed by confocal microscopy. (Top) Representative confocal images. The blue arrowhead indicates the Gag-YFP signal in the intracellular compartments. (Bottom) Bar graphs representing percentages of cell populations as described above.

