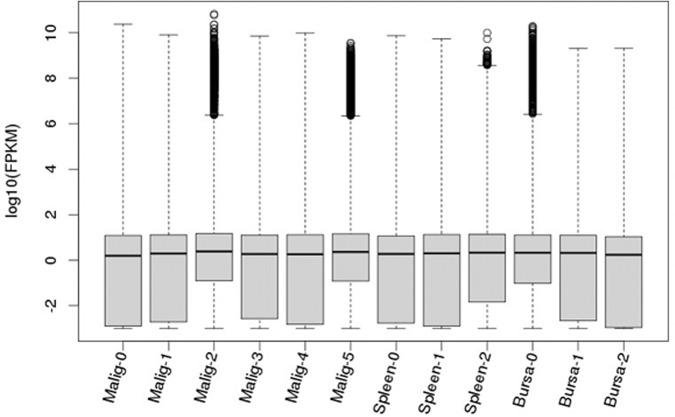
FIG 2.
Box-and-whisker plots of gene expression profiles for each of the malignant samples (Malig-0 to Malig-5) and nonmalignant samples, including the control groups of bursa tissues (Bursa-0 to Bursa-2) and splenic B cells (Spleen-0 to Spleen-2), illustrating the RNA-Seq read distribution and variability of the RNA-Seq samples. FPKM, fragments per kilobase per million.

