FIG 7.
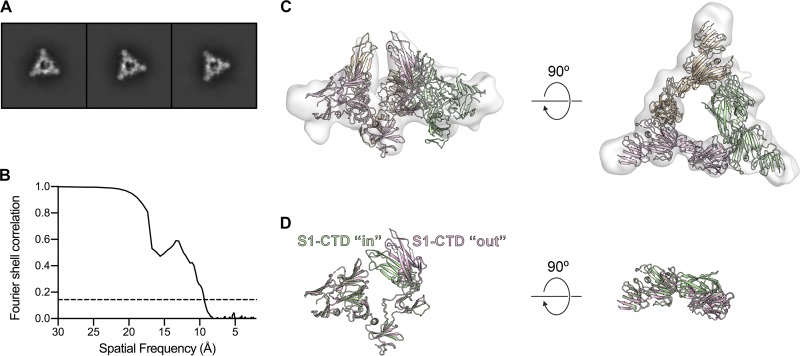
3D reconstruction of the dissociated PEDV S1 ring. (A) 2D class averages of the dissociated PEDV S1 trimer. (B) The Fourier shell correlation (FSC) curve used to calculate the resolution of the PEDV S1 ring reconstruction is shown as a solid black line and a correlation value of 0.143 is shown as a dashed line. (C) Residues 43 to 755 of PEDV S are shown as ribbons colored tan, pink, and green. The S1-CTDs of the pink and tan protomers have been repositioned to fit into the 3D reconstruction of the dissociated PEDV S1 ring, shown as a transparent surface. (D) The pink protomer and green protomer shown in panel C have been aligned to each other to highlight the conformational change of the S1-CTD.

