FIG 4.
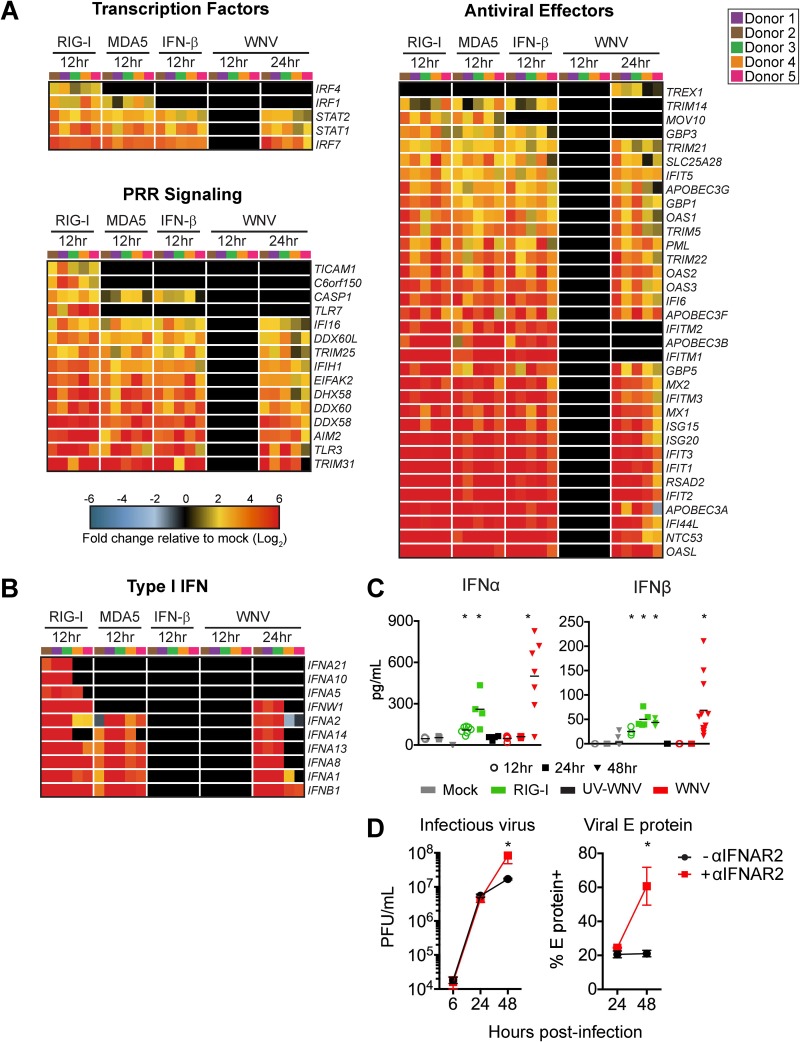
WNV induces robust antiviral and type I IFN responses. mRNA sequencing was performed on moDCs generated from 5 donors after treatment with RIG-I agonist (100 ng/1e6 cells for 12 h), high-molecular-weight poly(I·C), MDA5 agonist (100 ng/1e6 cells), or IFN-β (100 IU/ml) or WNV infection (MOI of 10; 12 and 24 hpi). (A) Heat map of differentially expressed genes (DEGs) corresponding to antiviral transcription factors, innate immune sensors, and antiviral effector genes. Genes that did not reach the significance threshold are depicted in black. (B) Heat map of DEGs corresponding to type I IFN responses. For all heat maps, the log2 normalized fold change in expression relative to expression in uninfected, untreated cells is shown (>2-fold change; significance, P < 0.01). Genes that did not reach the significance threshold are depicted in black. Each column within a treatment condition is marked by a unique color and represents a different donor (n = 5 donors). (C) Secretion of IFN-α and IFN β proteins into the supernatant following RIG-I agonist treatment (100 ng/1e6 cells), infection with UV-inactivated WNV (MOI of 10; UV-WNV), or infection with replication-competent WNV (MOI of 10; WNV). Data are shown for each donor with the mean (n = 4 to 11 donors). *, P < 0.05 (Kruskal-Wallis test). (D) moDCs were first incubated with or without anti-IFNAR2 (5 μg/ml) for 1 h and then infected with WNV at an MOI of 10. Infectious virus release into the supernatant (left panel) or viral E protein staining (right panel) was assessed at 6, 24, or 48 hpi. Data are represented as percent inhibition and shown for each donor with the mean (n = 5 to 6 donors). *, P < 0.05 (Kruskal-Wallis test).

