FIG 6.
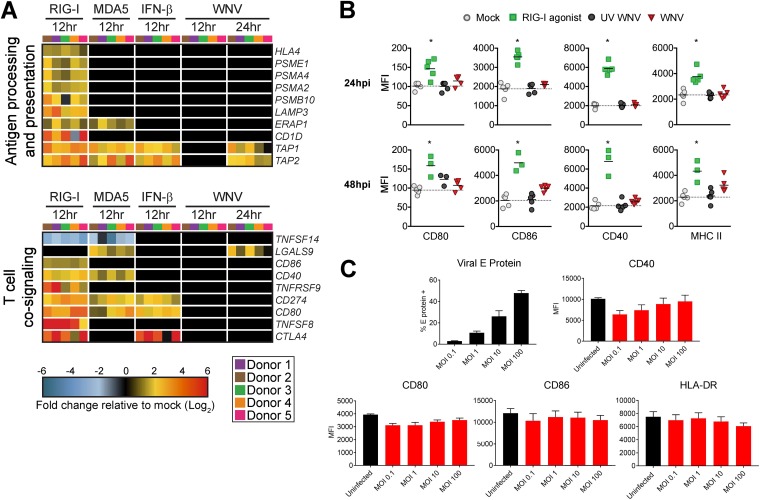
WNV-infected DCs fail to increase expression of molecules involved in antigen presentation and T cell costimulation. (A) Heat map of genes involved in antigen processing and presentation or T cell cosignaling. The log2 normalized fold change in expression relative to that in uninfected, untreated cells is shown (>2-fold change; significance, P < 0.01). Genes that did not reach the significance threshold are depicted in black. Each column within a treatment condition is marked by a unique color and represents a different donor (n = 5 donors). (B) Cell surface expression of CD80, CD86, CD40, or MHC-II was quantitated by flow cytometry following RIG-I agonist treatment (100 ng/1e6 cells), infection with UV-inactivated WNV (MOI of 10; UV-WNV), or infection with replication-competent WNV (MOI of 10; WNV). Responses were assessed at 24 h and 48 h following treatment or infection. (C) Cell surface expression of CD80, CD86, CD40, or MHC-II was quantitated by flow cytometry following infection with increasing MOIs of WNV at 24 hpi (MOIs of 0.1, 1, 10, and 100). For the experiments shown in panels B and C, WNV-infected moDCs were labeled for viral E protein, and data are shown for the E protein+ population. Data for each donor are shown as median fluorescence intensity (MFI) with the mean (n = 3 to 5 donors). *, P < 0.05 (Kruskal-Wallis test).

