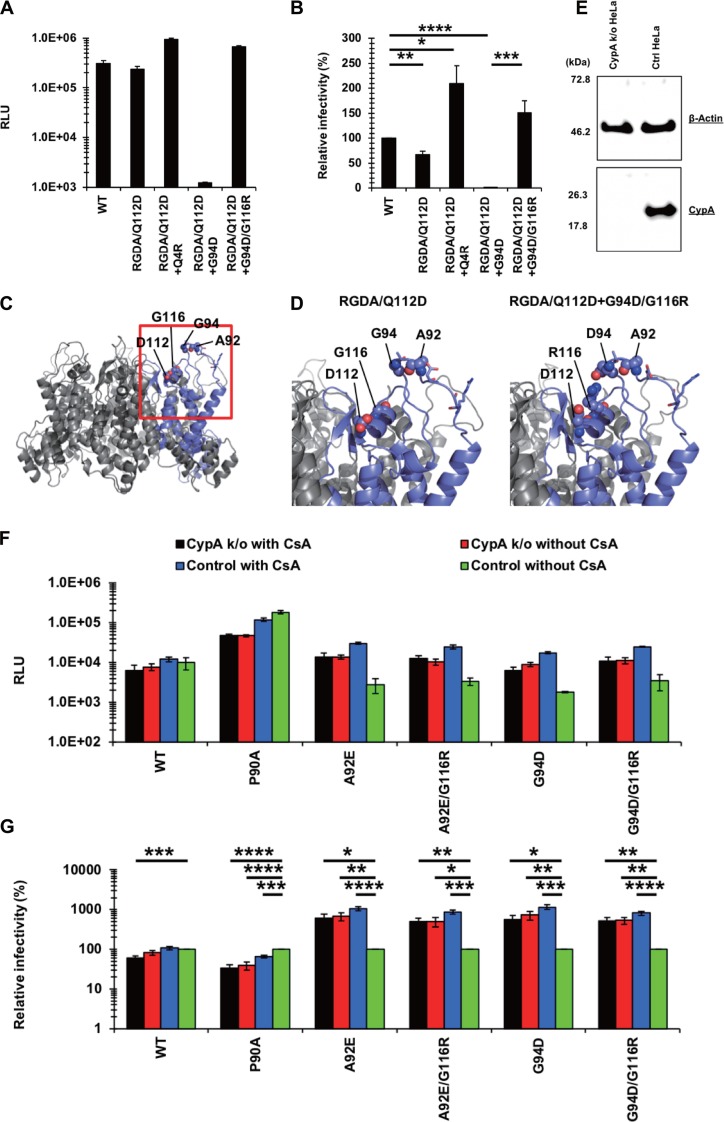
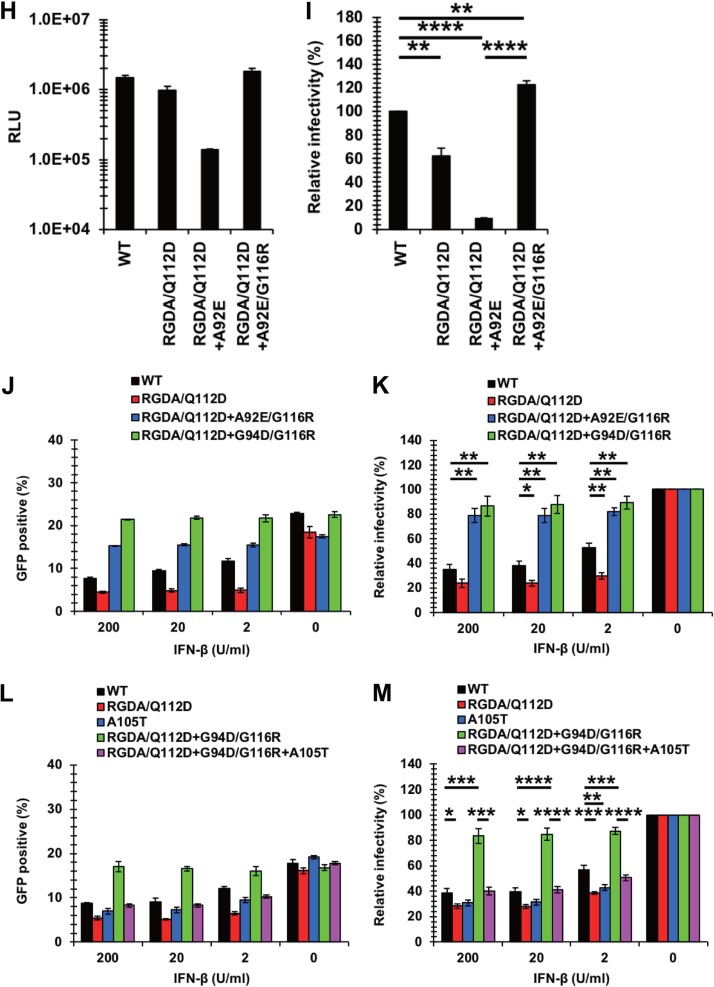
FIG 10.
The RGDA/Q112D virus obtained IFN-β resistance with the G94D mutation and then obtained the G116R mutation to compensate for the impaired infectivity. (A) Jurkat cells were infected with reverse transcriptase-normalized VSV-G-pseudotyped HIV-1 isolates encoding the NanoLuc reporter gene. The RLU were determined at 2 days after infection. One representative result of at least three independent experiments is shown, with error bars denoting the standard deviation (SD) of the mean of quadruplicate measurements. (B) The relative infectivity (compared with that of the WT virus [in percent]) was calculated by dividing the RLU of CA mutants by those of the WT virus. The mean from four independent experiments is shown, with error bars denoting the standard error of the mean (SEM). ****, P < 0.0001; ***, P < 0.001; **, P < 0.01; *, P < 0.05. (C) A structural model of a hexameric CA mutant of the RGDA/Q112D virus. A single chain is highlighted with a navy ribbon, while the other chains are shown as gray ribbons. The 92nd, 94th, 112th, and 116th residues are shown in sphere representations. The 87th, 88th, 90th, and 93rd residues are drawn as sticks. The 87th, 88th, 90th, 92nd, 93rd, and 94th residues positioned in a loop. The 112th and 116th residues were located in the same face of a helix. (D) Structures around the 94th and 116th residues. The highlighted area corresponds to the area surrounded by the red square in panel B. The G94D/G116R mutations could generate intramolecule salt bridges of R116 with the D94 residue. (E) Expression level of CypA in HeLa cells transduced with the pX459 plasmid targeting the CypA gene. Western blots of cell lysates extracted from unmodified and transduced cells were probed with an anti-CypA antibody (bottom) or an anti-β-actin antibody (top). The positions of the molecular weight markers are shown on the left side. (F) CypA-knockout (CypA k/o) or normal HeLa cells were infected with reverse transcriptase-normalized VSV-G-pseudotyped HIV-1 isolates encoding the luciferase reporter gene in the absence or presence of 2 μM cyclosporine (CsA). The RLU were determined at 2 days after infection. One representative result of at least three independent experiments is shown, with error bars denoting the standard deviation (SD) of the mean of triplicate measurements. (G) The relative infectivity (compared with that for control cells without CsA [in percent]) was calculated by dividing the RLU in CypA k/o or CsA-treated cells by those in control cells without CsA. The mean from five independent experiments is shown, with error bars denoting the standard error of the mean (SEM). ****, P < 0.0001; ***, P < 0.001; **, P < 0.01; *, P < 0.05. (H) Jurkat cells were infected with reverse transcriptase-normalized VSV-G-pseudotyped HIV-1 isolates encoding the NanoLuc reporter gene. The RLU were determined at 2 days after infection. One representative result of at least three independent experiments is shown, with error bars denoting the standard deviation (SD) of the mean of quadruplicate measurements. (I) The relative infectivity (compared with that of the WT virus [in percent]) was calculated by dividing the RLU of CA mutants by those of the WT virus. The mean from three independent experiments is shown, with error bars denoting the standard error of the mean (SEM). ****, P < 0.0001; **, P < 0.01. (J) Jurkat cells were treated with 200, 20, 2, or 0 U per ml of IFN-β for 16 h prior to infection. Cells were infected with VSV-G-pseudotyped HIV-1 isolates encoding GFP. The percentage of GFP-positive cells was determined at 2 days after infection. One representative result of at least three independent experiments is shown, with error bars denoting the standard deviation (SD) of the mean of triplicate measurements. (K) The relative IFN-β sensitivity (compared with that in untreated cells [in percent]) was calculated by dividing the percentage of GFP-positive cells among IFN-β-treated cells by the percentage of GFP-positive cells among untreated cells. The mean from three independent experiments is shown, with error bars denoting the standard error of the mean (SEM). **, P < 0.01; *, P < 0.05. (L) Jurkat cells were treated with 200, 20, 2, or 0 U per ml of IFN-β for 16 h prior to infection. Cells were infected with VSV-G-pseudotyped HIV-1 isolates encoding GFP. The percentage of GFP-positive cells was determined at 2 days after infection. One representative result of at least three independent experiments is shown, with error bars denoting the standard deviation (SD) of the mean of triplicate measurements. (M) The relative IFN-β sensitivity (compared with that in untreated cells [in percent]) was calculated by dividing the percentage of GFP-positive cells among IFN-β-treated cells by the percentage of GFP-positive cells among untreated cells. The means from five independent experiments are shown, with error bars denoting the standard error of the mean (SEM). ****, P < 0.0001; ***, P < 0.001; **, P < 0.01; *, P < 0.05.


