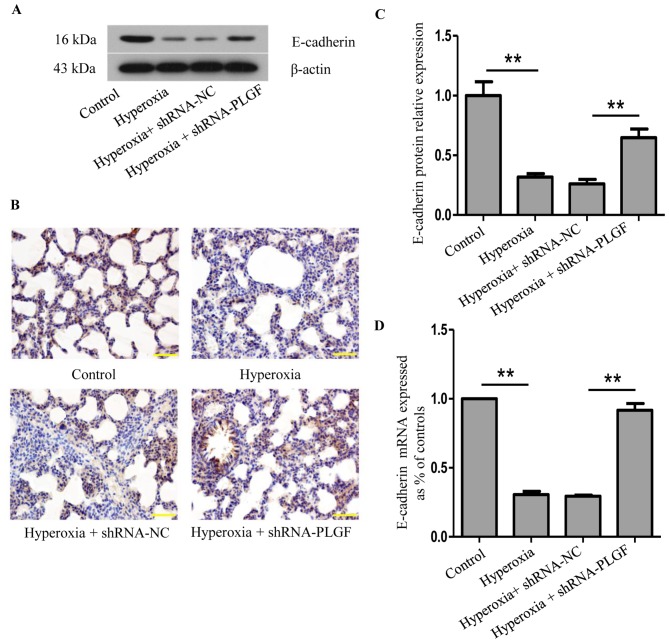
Figure 2.
Expression of E-cadherin in hyperoxia-exposed lung tissue. Neonatal rats were exposed to normoxic or hyperoxic conditions for 14 days; hyperoxia exposed rats were subsequently injected with shRNA-NC or shRNA-PLGF. (A) Western blot analysis and (B) quantification was performed to determine E-cadherin protein expression levels in rat lung tissues; β-actin was used as the endogenous control. Data are presented as the mean ± standard deviation. n=8. **P<0.01. (C) Immunostaining of rat lung tissues for E-cadherin expression; hematoxylin was used as a counterstain. Magnification, ×100; scale bar, 100 µm. (D) E-cadherin mRNA expression levels were detected by reverse transcription-quantitative PCR. Data are presented as the mean ± standard deviation. n=3. **P<0.01. E-cadherin, epithelial cadherin; NC, negative control; PLGF, placental growth factor; shRNA, short hairpin RNA.

