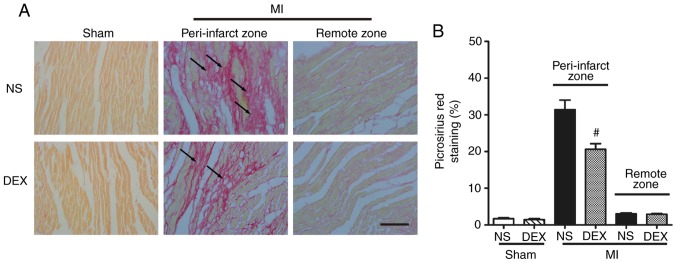
Figure 2.
Analysis of pathological cardiac remodeling with picrosirius red staining. (A) Representative images of picrosirius red-stained sections in the Sham + NS, Sham + DEX, MI + NS, and MI + DEX mice. Scale bar, 50 µm. (B) Quantitative analysis of picrosirius red-positive area in the Sham + NS, Sham + DEX, MI + NS, and MI + DEX mice. Data are presented as mean ± standard error of the mean (n=6. #P<0.05 vs. MI + NS group. NS, normal saline; DEX, dexmedetomidine; MI, myocardial infarction.

