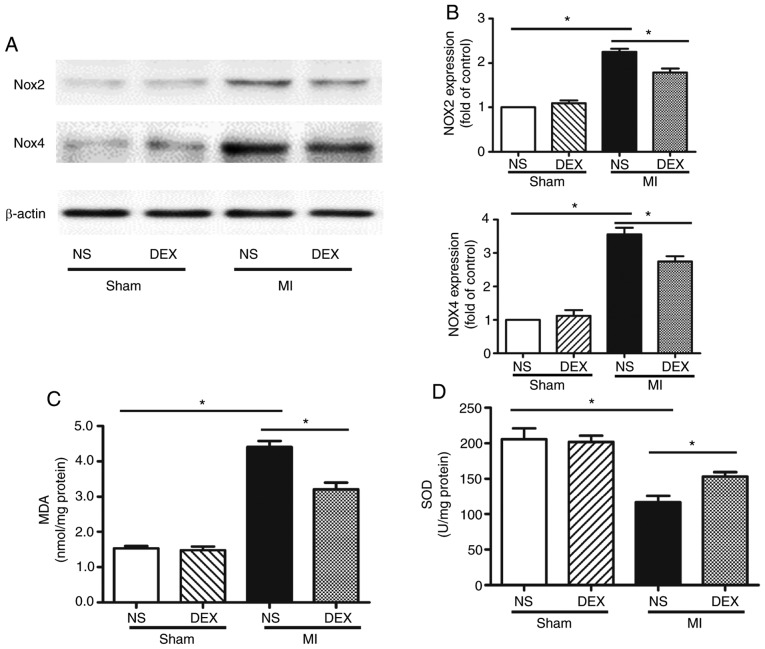
Figure 4.
Western blot analysis of NOX2 and NOX4 expression and SOD and MDA assays. (A) Representative gel images and (B) quantitative densitometric analysis of western blot analysis data demonstrating the expression levels of NOX2 and NOX4 proteins in the Sham + NS, Sham + DEX, MI + NS, and MI + DEX mice. (C) Analysis of MDA content in the Sham + NS, Sham + DEX, MI + NS, and MI + mice. (D) Analysis of SOD activity in the Sham + NS, Sham + DEX, MI + NS, and MI + DEX mice. Data are presented as mean ± standard error of the mean. n=6. *P<0.05. NOX, nicotinamide adenine dinucleotide phosphate oxidase; NS, normal saline; DEX, dexmedetomidine; MI, myocardial infarction.

