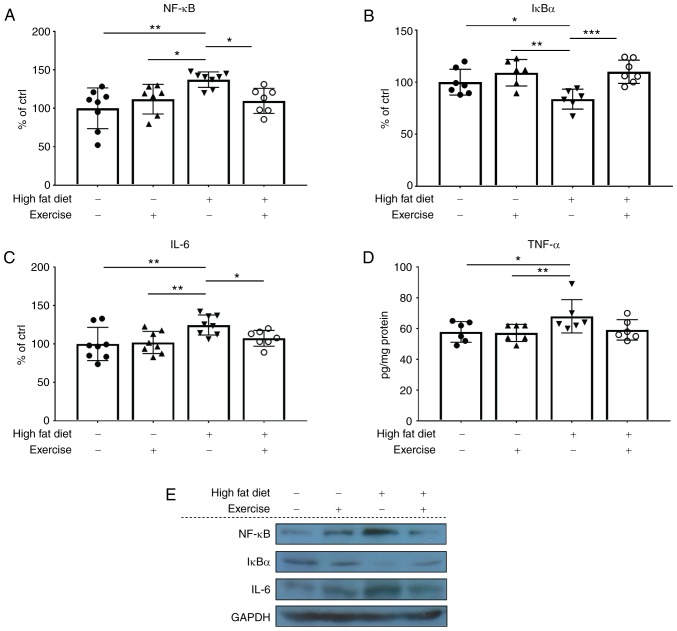
Figure 4.
Protein expression levels of (A) NF-κB, (B) IκBα and (C) IL-6 were examined using western blot analysis. (D) Levels of TNF-α were examined using ELISA. (E) Representative western blot analysis gel using samples from in the skeletal muscles of the control, exercise, HFD and HFD + exercise groups. TNF-α data are presented as pg/mg protein. Western blot analysis data are presented as mean ± standard deviation. *P<0.05, **P<0.01 and ***P<0.001. The results are presented as relative to the control group, which was arbitrarily assigned a value of 100. IκBα, NF-κB inhibitor α; IL-6, interleukin-6; TNF-α, tumor necrosis factor-α; HFD, high-fat diet.

